Outcome
Your projection reflects your underwriting, including how vacant space leases up, and shows debt service, reserves, and an exit value.
Navigation path
Document wizard > Valuation > Assumptions
Access
Full Financials with Multi-Year Cash Flow
On this page
Before you start
Data, sources, and access to prepare
- Full Financials
- A Multi-Year Cash Flow rent-roll type
- Your hold period, vacancy, lease-up, exit, debt, and reserve assumptions
See what each assumption controls
Assumptions to outputs
Each card changes a distinct part of the annual projection.
Analysis Period
Years 1 through N
Vacancy and lease-up
General Vacancy Factor % and Lease-Up Scenario
Exit Pricing
Exit-year NOI divided by exit cap
Financing
Annual debt service
Reserves
Below-NOI deductions
Cash Flow Projection
Combined annual result
- Analysis PeriodCash Flow Projection
- Vacancy and lease-upCash Flow Projection
- Exit PricingCash Flow Projection
- FinancingCash Flow Projection
- ReservesCash Flow Projection
Analysis
- Key inputs
- Analysis Period (1 to 10 years), Start Date, General Vacancy Factor %, Lease-Up Scenario, Stabilized Year
- Shown when
- Cash Flow. The vacancy and lease-up fields are hidden for Hospitality and Single Tenant Net Lease.
Exit Pricing
- Key inputs
- On/off toggle, Exit Year, Cap Rate %
- Shown when
- Cash Flow
Financing
- Key inputs
- Loan Amount, Rate %, I/O (yrs), Amort. (yrs), Term (yrs)
- Shown when
- Cash Flow and Pro Forma
Reserves
- Key inputs
- Three annual rates labeled for the property type
- Shown when
- Cash Flow and Pro Forma
Two defaults that change NOI
Lease-Up Scenario starts at 100% Immediate, which treats every vacancy row as leased from Year 1 with no downtime. In-Place still shows the space vacant, so Year 1 NOI can jump. Choose a slower scenario to phase the space in. General Vacancy Factor % starts blank. The gray 5 is only a placeholder, so no general vacancy or credit loss is deducted until you type a rate.
Enter assumptions with the correct meaning
Check reserve dollars
Each reserve rate is multiplied by its displayed basis: commercial square feet, multifamily or storage units, hotel keys, or park pads, counting occupied and vacant inventory. In the Juniper Market Center sample, $0.25 + $0.20 + $0.35 = $0.80 per SF x 48,600 SF = $38,880 of reserves per year.
Analysis Period Required
Number of projected years after In-Place.
- Format
- Whole number from 1 through 10
- Units
- Projected years
- Save behavior
- Autosaves after selection; wait for the saved state before leaving.
- Downstream effect
- Sets how many annual columns follow In-Place in the cash-flow preview and output.
Analysis Start Date Recommended
Date context for the projection.
- Format
- Calendar date
- Units
- Date
- Save behavior
- Autosaves after the date change; verify the saved assumptions retain it.
- Downstream effect
- Supplies the date context used to label the projection period.
General Vacancy Factor % Optional
General vacancy and credit loss, taken as a percentage of base rent after vacancy rows are deducted. It applies to In-Place and every projected year, on top of any vacancy rows. It does not apply to expense reimbursements or other income.
- Format
- Percentage
- Units
- Percent of occupied and leased-up base rent
- Save behavior
- Autosaves after entry; wait for the preview and saved state to update.
- Downstream effect
- Adds the Less: Vacancy Factor row and lowers EGI and NOI in every column.
Lease-Up Scenario and Stabilized Year Recommended
How fast vacancy rows lease up. The percentage is the share of vacant-space rent counted as leased in Year 1: 100% Immediate (default), Aggressive 75%, Moderate 50%, Conservative 25%, or Slow 10%. It ramps in a straight line to 100% by the Stabilized Year.
- Format
- Select a scenario; Stabilized Year appears for scenarios below 100%
- Units
- Percent of vacant-space rent and projected year
- Save behavior
- Autosaves after the scenario or stabilized year changes.
- Downstream effect
- Sets the Less: Vacancy row and the vacant spaces' reimbursements in each projected year. In-Place always deducts the full vacant-space rent.
Exit Year and Cap Rate % Required
The projected year whose NOI is capitalized, and the exit cap rate.
- Format
- Projected year plus positive percentage
- Units
- Year number and percent
- Save behavior
- Autosaves while Exit Pricing is enabled; confirm the card shows the intended Exit NOI and Exit Price.
- Downstream effect
- Calculates Exit Price as the selected year's own NOI divided by the exit cap rate, before selling costs.
Loan Terms Optional
Principal, rate, interest-only period, amortization, and term used for debt service.
- Format
- Currency principal, annual percentage rate, and whole-year periods
- Units
- Currency, percent per year, and years
- Save behavior
- Autosaves while Financing is enabled; verify the payment preview after the saved state.
- Downstream effect
- Recalculates estimated payment, annual debt service, and cash after debt.
Reserve Rates Optional
Three annual reserve inputs labeled for the property type.
- Format
- Nonnegative currency rates
- Units
- Currency per square foot, unit, room key, or pad per year, as displayed for the property
- Save behavior
- Autosaves shortly after entry; reopen assumptions to confirm the values stayed.
- Downstream effect
- Deducts reserves below NOI at rate x total inventory (occupied plus vacant). The same dollar amount applies to In-Place and every projected year, without growth.
Analysis Period
- Requirement
- Required
- What it means
- Number of projected years after In-Place.
- Format
- Whole number from 1 through 10
- Units
- Projected years
- Save behavior
- Autosaves after selection; wait for the saved state before leaving.
- Downstream effect
- Sets how many annual columns follow In-Place in the cash-flow preview and output.
Analysis Start Date
- Requirement
- Recommended
- What it means
- Date context for the projection.
- Format
- Calendar date
- Units
- Date
- Save behavior
- Autosaves after the date change; verify the saved assumptions retain it.
- Downstream effect
- Supplies the date context used to label the projection period.
General Vacancy Factor %
- Requirement
- Optional
- What it means
- General vacancy and credit loss, taken as a percentage of base rent after vacancy rows are deducted. It applies to In-Place and every projected year, on top of any vacancy rows. It does not apply to expense reimbursements or other income.
- Format
- Percentage
- Units
- Percent of occupied and leased-up base rent
- Save behavior
- Autosaves after entry; wait for the preview and saved state to update.
- Downstream effect
- Adds the Less: Vacancy Factor row and lowers EGI and NOI in every column.
Lease-Up Scenario and Stabilized Year
- Requirement
- Recommended
- What it means
- How fast vacancy rows lease up. The percentage is the share of vacant-space rent counted as leased in Year 1: 100% Immediate (default), Aggressive 75%, Moderate 50%, Conservative 25%, or Slow 10%. It ramps in a straight line to 100% by the Stabilized Year.
- Format
- Select a scenario; Stabilized Year appears for scenarios below 100%
- Units
- Percent of vacant-space rent and projected year
- Save behavior
- Autosaves after the scenario or stabilized year changes.
- Downstream effect
- Sets the Less: Vacancy row and the vacant spaces' reimbursements in each projected year. In-Place always deducts the full vacant-space rent.
Exit Year and Cap Rate %
- Requirement
- Required
- What it means
- The projected year whose NOI is capitalized, and the exit cap rate.
- Format
- Projected year plus positive percentage
- Units
- Year number and percent
- Save behavior
- Autosaves while Exit Pricing is enabled; confirm the card shows the intended Exit NOI and Exit Price.
- Downstream effect
- Calculates Exit Price as the selected year's own NOI divided by the exit cap rate, before selling costs.
Loan Terms
- Requirement
- Optional
- What it means
- Principal, rate, interest-only period, amortization, and term used for debt service.
- Format
- Currency principal, annual percentage rate, and whole-year periods
- Units
- Currency, percent per year, and years
- Save behavior
- Autosaves while Financing is enabled; verify the payment preview after the saved state.
- Downstream effect
- Recalculates estimated payment, annual debt service, and cash after debt.
Reserve Rates
- Requirement
- Optional
- What it means
- Three annual reserve inputs labeled for the property type.
- Format
- Nonnegative currency rates
- Units
- Currency per square foot, unit, room key, or pad per year, as displayed for the property
- Save behavior
- Autosaves shortly after entry; reopen assumptions to confirm the values stayed.
- Downstream effect
- Deducts reserves below NOI at rate x total inventory (occupied plus vacant). The same dollar amount applies to In-Place and every projected year, without growth.
Required means the field is needed to complete or support this workflow. Some screens allow a draft to save before every required item is complete. The steps and troubleshooting call out controls the product actively blocks.
Configure and save assumptions
Assumption steps
- 1
Set the analysis period
Valuation, Assumptions, Analysis Period
Select an analysis period from 1 to 10 years.
Expected result: The preview displays In-Place plus the selected number of projected years.
If this step does not work
If the horizon is wrong, change Analysis Period and wait for autosave.
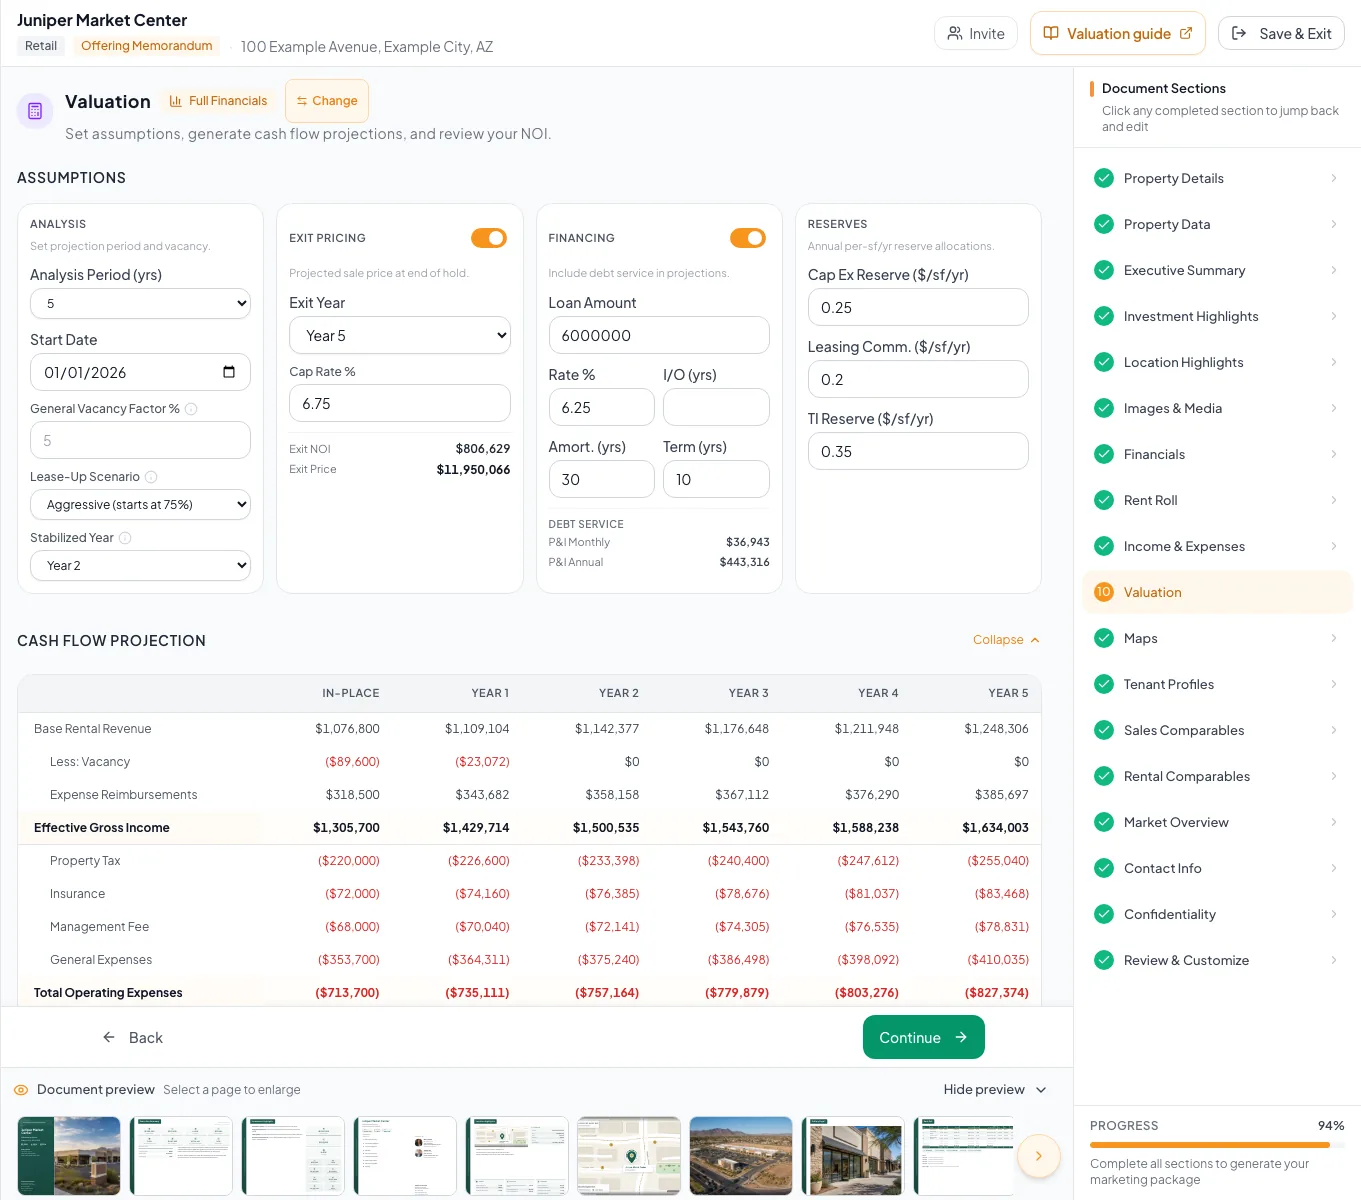
Set the analysis period and investment assumptions, then verify how each choice affects projections and exit value. - 2
Set the analysis start date
Valuation, Assumptions, Analysis Start Date
Enter the analysis start date.
Expected result: The saved assumptions show the intended start date.
If this step does not work
Correct the date if the displayed period does not match your analysis.
- 3
Enter the vacancy factor
Assumptions, Analysis > General Vacancy Factor %
Enter your general vacancy and credit-loss rate.
Expected result: The Less: Vacancy Factor row appears in every column, including In-Place.
If this step does not work
Enter a percentage such as 5, not 0.05. Leave it blank for 0%.
- 4
Choose the lease-up path
Assumptions, Analysis > Lease-Up Scenario
Select the scenario that matches how fast the vacant space should lease.
Expected result: The Year 1 vacancy deduction follows the selected starting percentage.
If this step does not work
Keep 100% Immediate only when every vacancy row should count as leased from Year 1.
- 5
Set the stabilized year
Assumptions, Analysis > Stabilized Year
Select the year the vacant space is fully leased.
Expected result: The vacancy deduction ramps down to $0 by that year.
If this step does not work
Stabilized Year appears only for scenarios below 100% and an analysis period longer than one year.
- 6
Enable exit pricing
Assumptions, Exit Pricing
Turn on Exit Pricing.
Expected result: The exit year and cap-rate controls become available.
If this step does not work
Leave exit pricing off when your analysis has no sale assumption.
- 7
Select the exit year
Assumptions, Exit Pricing > Exit Year
Select the year whose NOI should set the sale price.
Expected result: The card shows that year's NOI as Exit NOI.
If this step does not work
Choose a year within the analysis period.
- 8
Enter the exit cap rate
Assumptions, Exit Pricing > Cap Rate %
Enter your exit cap rate.
Expected result: The card shows Exit NOI and Exit Price.
If this step does not work
If price is blank, confirm the cap rate is nonzero and the selected year has NOI.
- 9
Enable financing
Assumptions, Financing
Turn on financing.
Expected result: The loan assumption fields become available.
If this step does not work
Leave financing off to present the deal unlevered.
- 10
Enter the financing terms
Assumptions, Financing
Complete the loan amount, interest rate, interest-only years, amortization, and term fields.
Expected result: Estimated payment and annual debt service update.
If this step does not work
Check that IO years do not exceed the intended loan period and all rates use percent units.
- 11
Enter reserve rates
Assumptions, Reserves
Enter the reserve rates that apply.
Expected result: The values autosave and a Reserves row appears below NOI.
If this step does not work
Keep the page open until the saved state appears.
- 12
Verify saved reserves
Assumptions, Reserves
Reopen the assumptions after autosave completes.
Expected result: Values persist and the preview includes reserve rows.
If this step does not work
If values revert, retry each rate and verify reserve dollars against the intended basis.
Check calculated assumptions
Exit uses the exit year's own NOI
CREBuilder capitalizes the selected year's NOI, not the following year's, and shows the price before selling costs. To capitalize forward NOI on a five-year hold, set Analysis Period to 6 and Exit Year to Year 6 so Year 6 NOI sets the price. Deduct selling costs in your own reversion math or explain them in a footnote.
Cash flow cannot generate
Likely cause: The projection needs saved assumptions.
- Change one assumption if needed.
- Wait for autosave.
- Retry the preview.
Debt service stops before the analysis ends
Likely cause: The configured loan term ended.
- Confirm the loan term in years.
- Model only the period actually financed or update the assumption.
Reserve dollars do not match a per-unit expectation
Likely cause: Reserves equal rate x total inventory (occupied plus vacant). A missing vacancy row, a grouped count, or a different rate changes the total.
- Recalculate rate x total SF, units, keys, or pads.
- Check the inventory counts in the rent roll.
- Correct the rate or the inventory row.
Year 1 NOI jumps above In-Place
Likely cause: In-Place deducts all vacant-space rent, while Year 1 counts the share leased under the Lease-Up Scenario plus one year of growth. With 100% Immediate, all of it is leased in Year 1.
- Choose a slower Lease-Up Scenario.
- Set the Stabilized Year.
- Compare the Less: Vacancy row by year.
Final verification
- Assumptions, Financing: The loan assumption fields become available.
- Assumptions, Financing: Estimated payment and annual debt service update.
- Assumptions, Reserves: The values autosave and a Reserves row appears below NOI.
- Assumptions, Reserves: Values persist and the preview includes reserve rows.
- No blocking warning, failed status, or unresolved validation message remains in the completed workflow.
Related guides
Read and verify the cash-flow projection
Read the Multi-Year Cash Flow line by line, from base rent to cash flow after debt, so you can explain every number to a buyer.
Open guideModel rent escalations and reimbursements
Model fixed bumps, step-ups, and expense recoveries per tenant so every projected year matches the lease.
Open guideVerify financial pages before publishing
Do a final pass on the financial pages before you send: the right pages, the right labels, and numbers that tie out.
Open guideYour next OM, done this afternoon
Turn your property facts, photos and financials into a polished, branded offering memorandum. Most brokers finish in 30 to 90 minutes.
No credit card required.