Financial Analysis
Build professional financial analysis for any commercial property type. From rent rolls and income projections to cap rate valuation and multi-year cash flows, CREBuilder automates the math so you can focus on the deal.
Financial terms can pile up. Open the CRE Glossary for plain-English definitions of NOI, Cap Rate, NNN, Pro Forma, IRR, Cash-on-Cash, ADR, RevPAR, WACR, and every other term used on this page.
Financial Scope
The first step in the financials workflow is choosing a financial scope. This determines which wizard steps are active and how much financial detail appears in your final document. You can change the scope at any time.
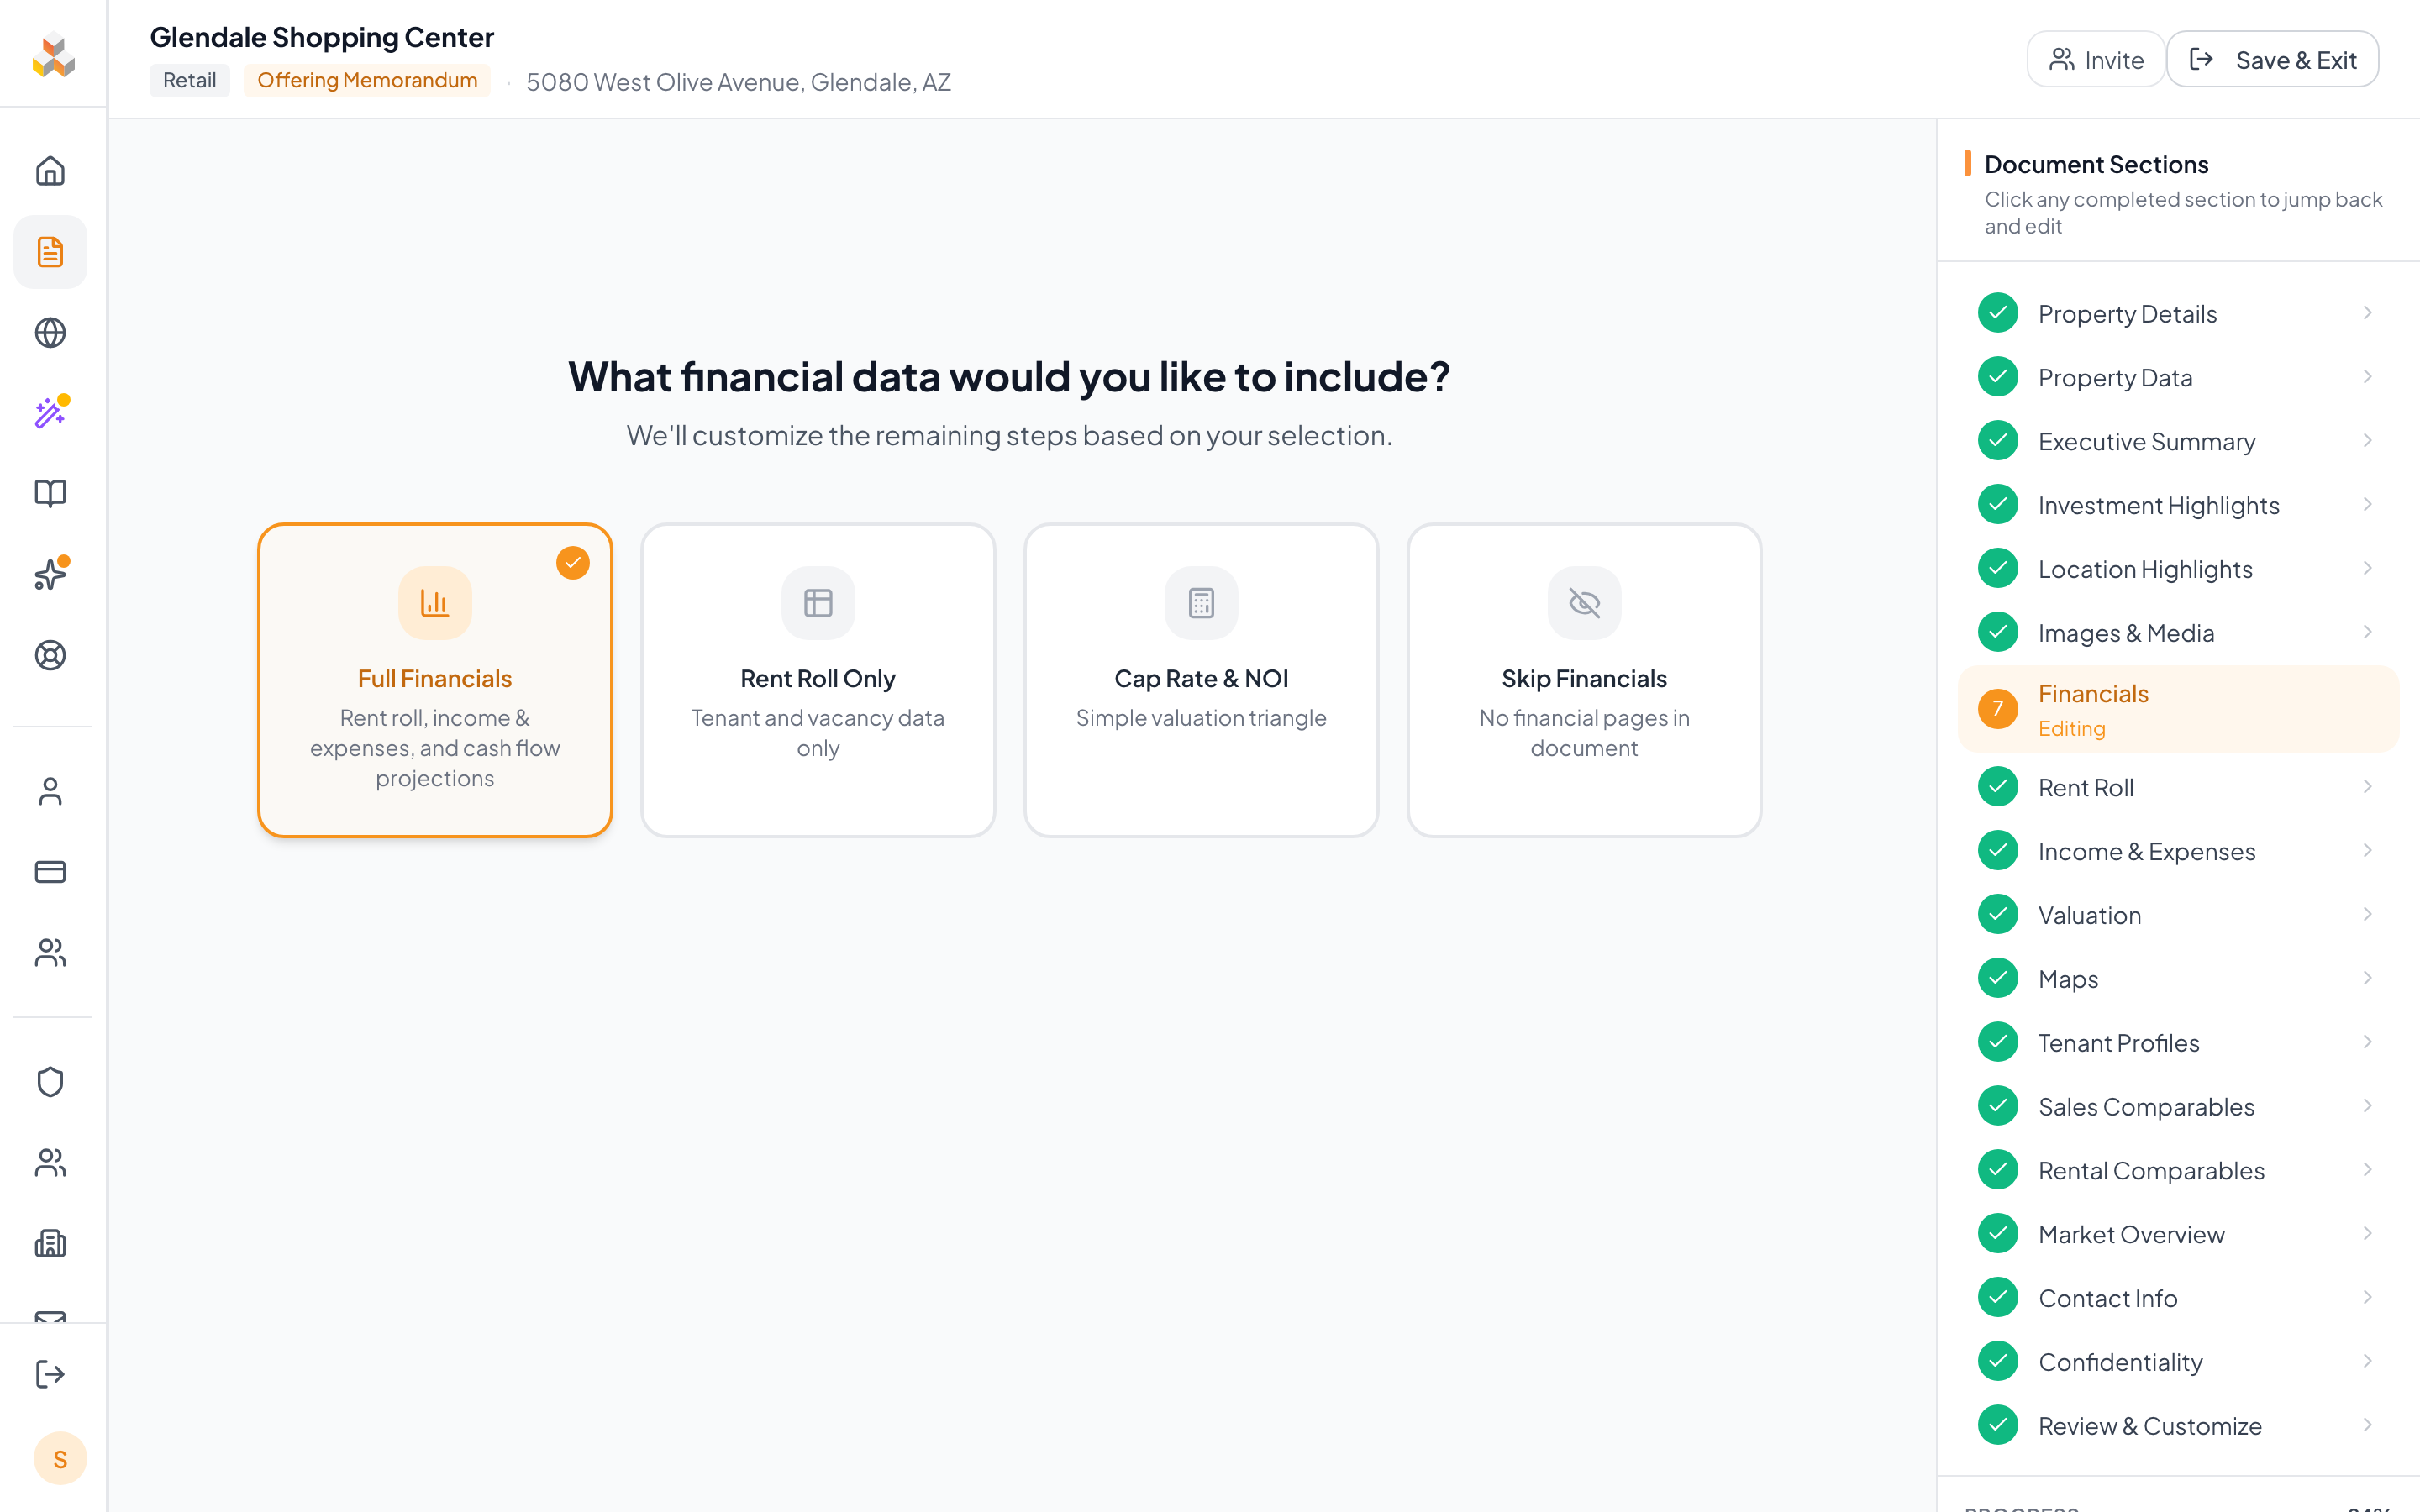
Rent roll, income & expenses, and multi-year cash flow projections. The complete package for investment sales.
When to pick: Pick this when you have BOTH a rent roll AND expense numbers. Default for stabilized income properties.
- Rent Roll
- Income & Expenses
- Cash Flow Projections
- Valuation & Cap Rate
- Comparables
Tenant and vacancy data without pro forma projections. Good for leasing packages or early-stage marketing.
When to pick: Pick this for NNN-leased properties where the tenant handles operating costs, or when you have rents but no detailed expense data.
- Rent Roll
- Valuation & Cap Rate
- Comparables
Simple valuation triangle: enter any two of cap rate, NOI, and price, and the third auto-calculates.
When to pick: Pick this when your broker only gave you a price + cap rate (no detailed rent roll). Common on confidential listings or early teasers.
- Valuation Metrics Only
- Comparables
No financial pages in the document. Best for land sites, confidential listings, or non-income properties.
When to pick: Pick this for raw land deals, development sites, or situations where financials are shared separately under NDA.
Net Lease properties remove the "Rent Roll Only" option since they have a single tenant. Upgrading scope auto-advances to the next step. Downgrading shows a confirmation dialog, but your existing data is preserved if you switch back.
Rent Roll Setup
The rent roll is the foundation of your financial analysis. Add tenants, enter lease terms and rent amounts, mark vacant units, and watch totals auto-calculate. The rent roll format adapts based on your property type.
Rent roll adapts by property type
Standard (Retail, Office, Industrial)
SF-based Rent Roll
Individual tenant rows with suite number, square footage, lease dates, and monthly/annual rent.
Multifamily
Unit Mix
Group by unit type (Studio, 1BR, 2BR). Enter unit count, average SF, and rent per unit. Totals auto-calculate.
Hospitality
Room Inventory
Room types with nightly rates and occupancy. Calculates ADR (Average Daily Rate) and RevPAR (Revenue Per Available Room) automatically. GOPPAR requires departmental P&L allocations and is not currently calculated — capture it manually if needed.
Self-Storage
Unit Inventory
Size tiers (5x5, 10x10, etc.) with per-unit monthly rent. Tracks occupancy by tier.
Mobile Home Parks
Pad Inventory
Lot rent per pad with occupancy tracking. Price/Pad is the primary valuation metric.
Net Lease
Single Tenant
Simplified form for single-tenant NNN properties. Lease term, rent escalations, and tenant credit info.
Mixed-Use
Component Sections
Separate commercial and residential sections, each with its own rent roll format, combined into one summary.
Adding tenants
- 1Click "Add Tenant" to create a new row in the rent roll.
- 2Enter the tenant name, suite number, and square footage.
- 3Set lease start and end dates. Monthly and annual rent auto-calculate from each other.
- 4Click the row to open the detail drawer for additional fields: expense reimbursements, rent escalations, and tenant profile data.
- 5Mark any unit as vacant by toggling the vacancy status. Vacant units show in a separate section.
Auto-calculated totals
As you enter data, the rent roll header updates in real time:
- Total SF — sum of all tenant and vacant square footage
- Weighted Avg Rent — rent per SF weighted by each tenant's area
- Occupancy — occupied SF / total SF, displayed as a percentage
- Total Annual Income — sum of all tenant rents (excludes vacancies)
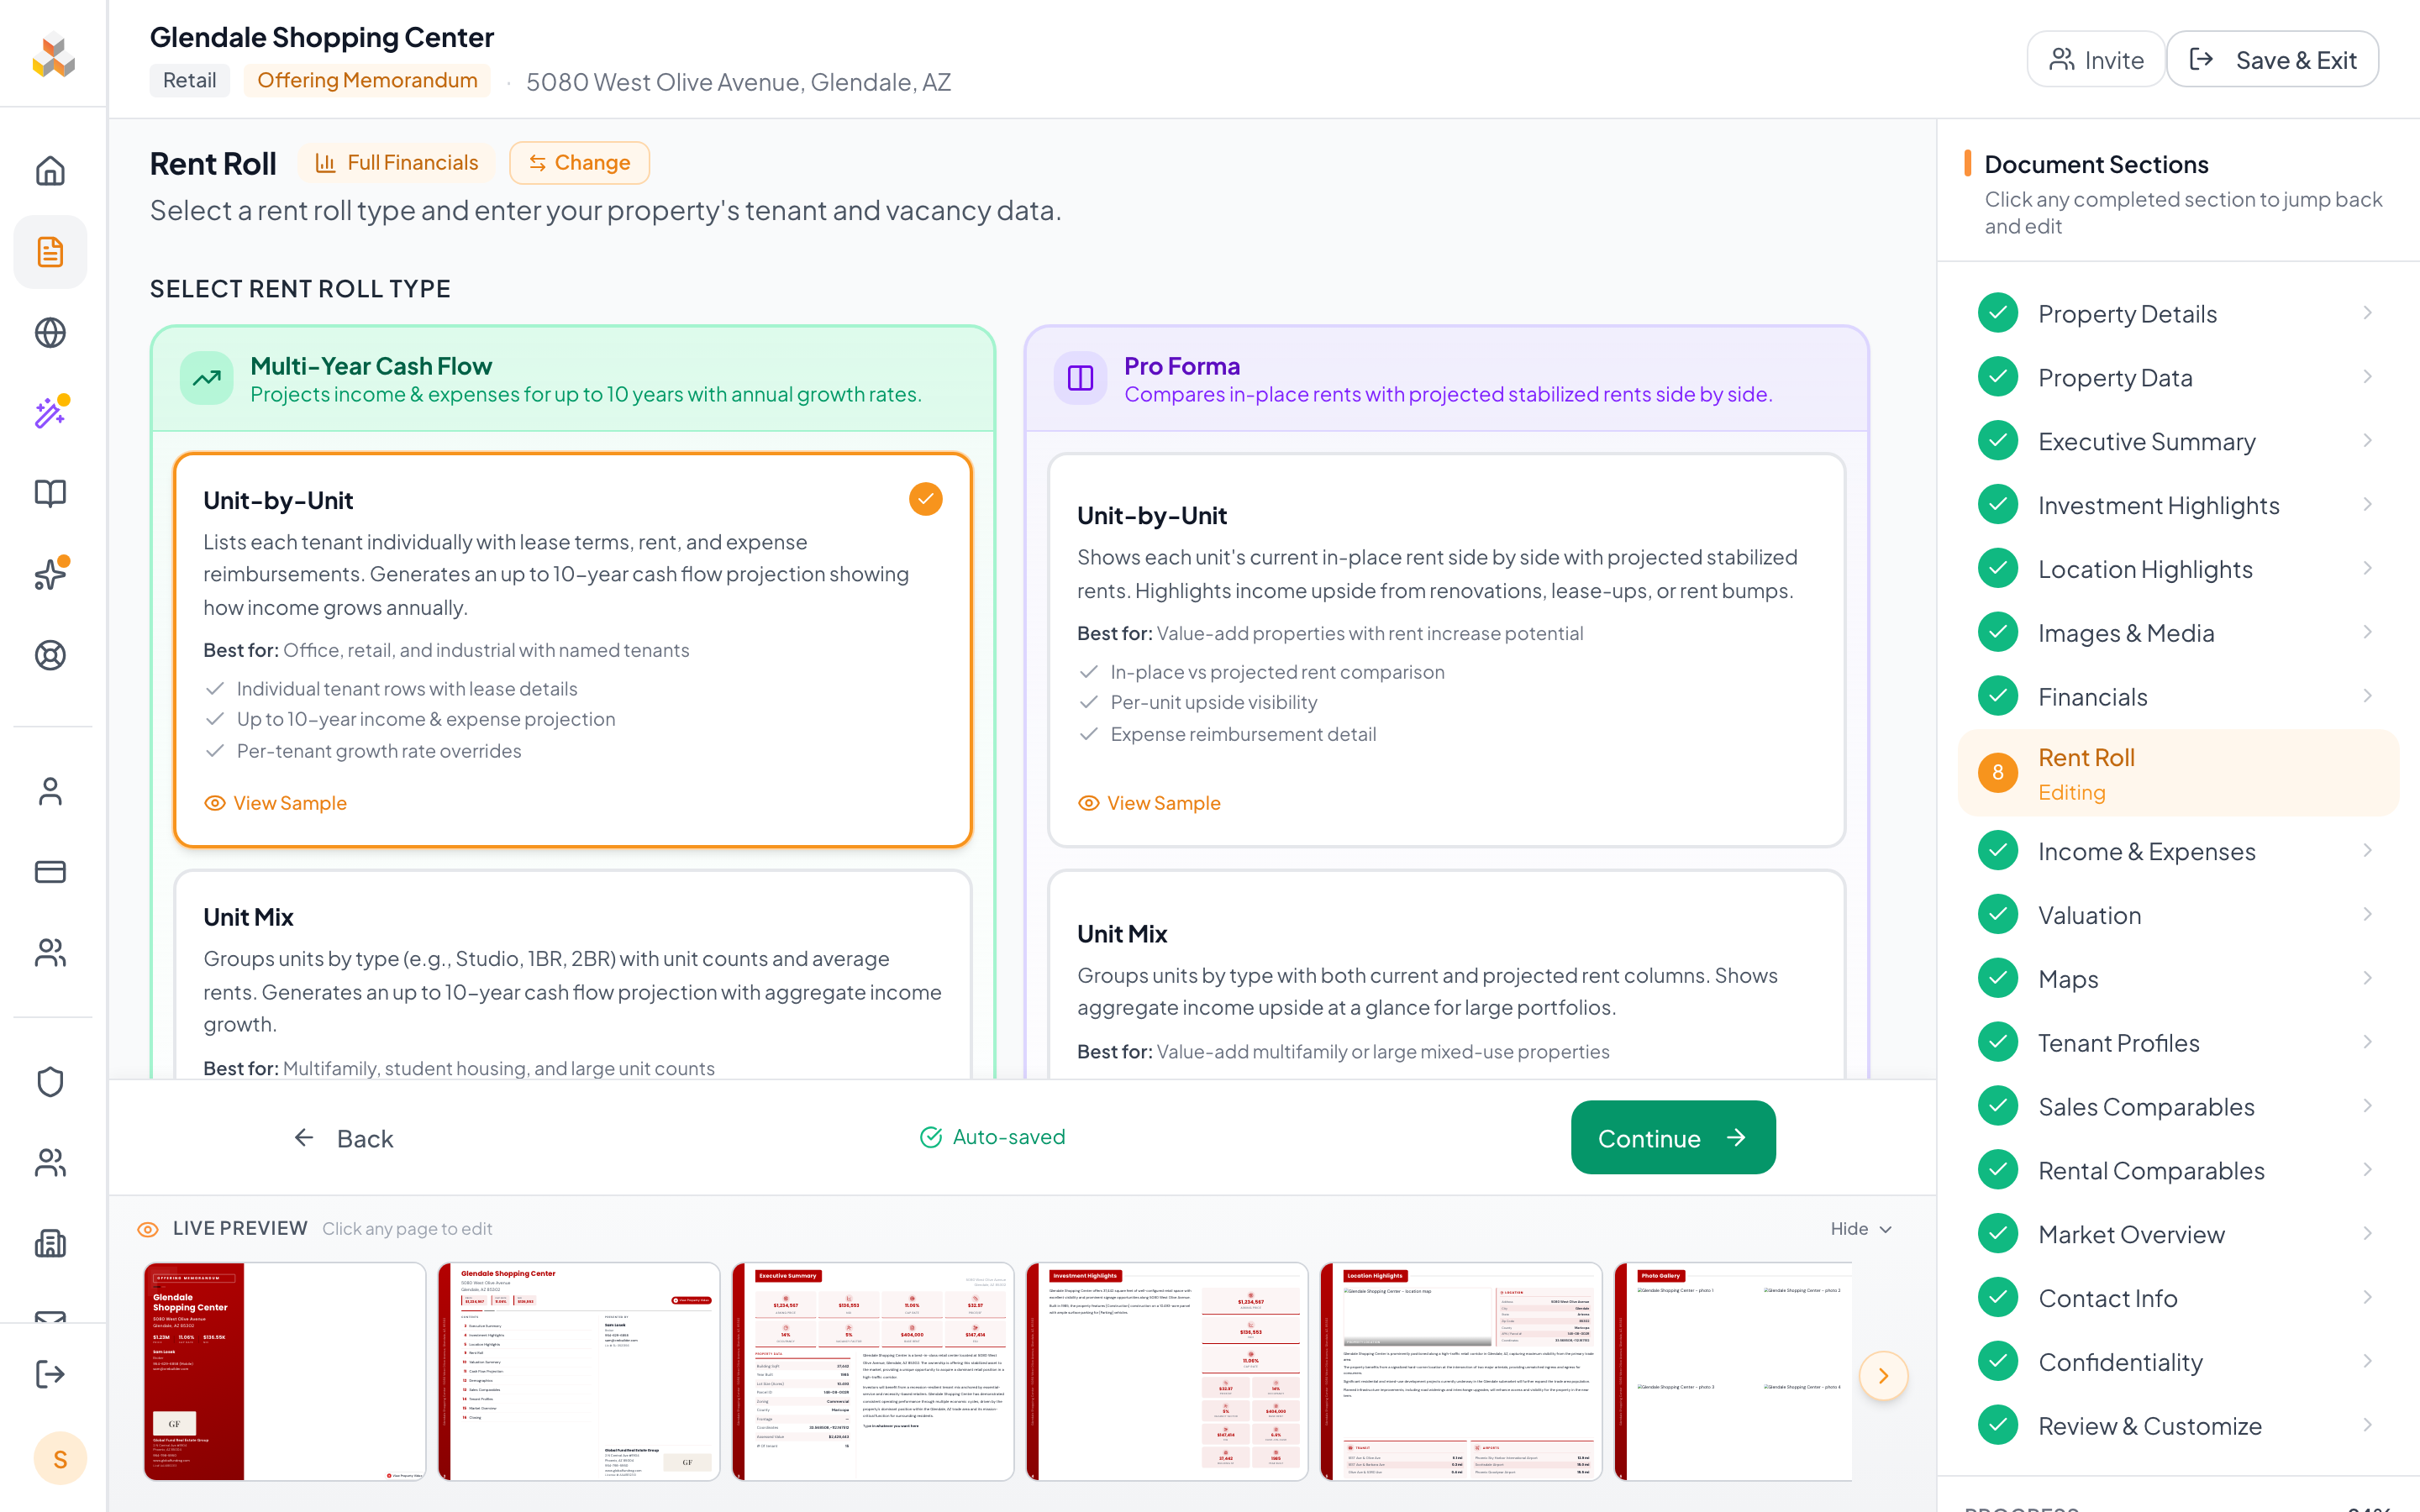
Rent roll type selector
For standard property types (Retail, Office, Industrial, Multifamily), you also choose a rent roll format and projection type:
Unit-by-Unit + Cash Flow
Each tenant listed individually. Generates a multi-year cash flow projection showing how income grows annually.
Unit Mix + Cash Flow
Units grouped by type (1BR, 2BR, etc.) with counts and average rents. Multi-year aggregate projection.
Unit-by-Unit + Pro Forma
In-place vs projected rent side by side. Highlights upside from renovations, lease-ups, or rent bumps.
Unit Mix + Pro Forma
Grouped by type with current and projected columns. Shows aggregate income upside for large portfolios.
Switching rent roll types preserves your underlying tenant data. You can change the format at any time without losing entries.
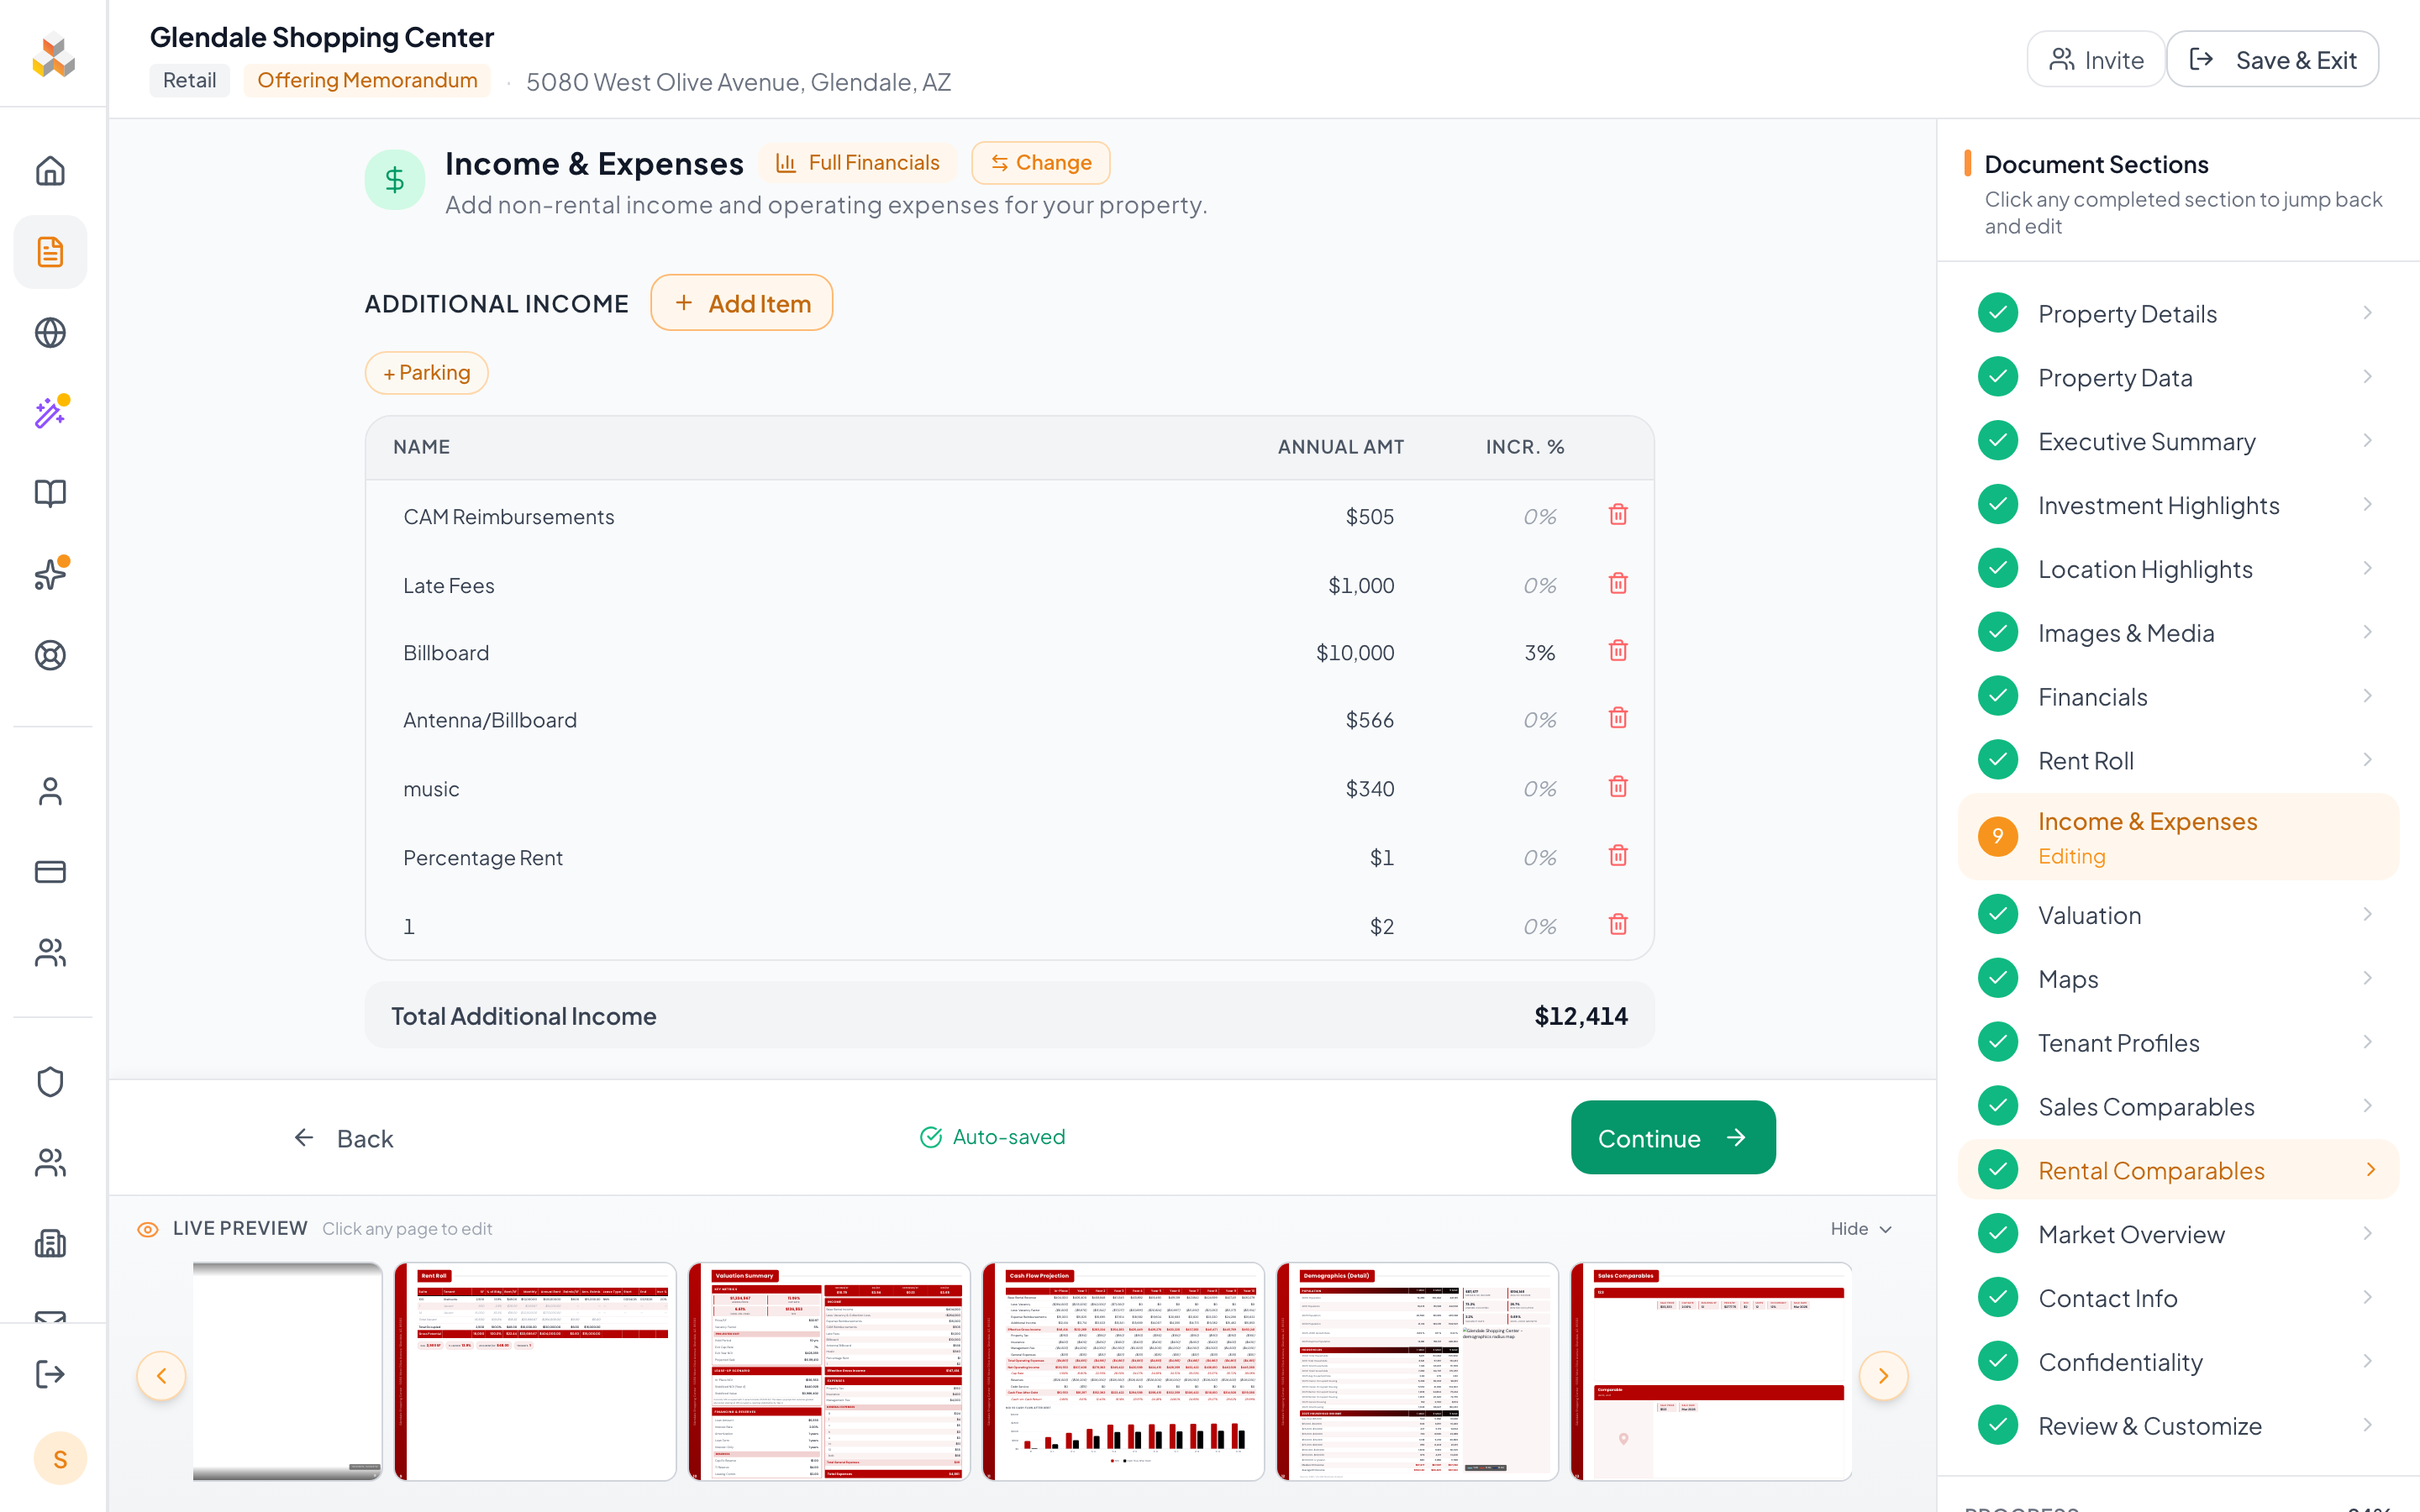
Income & Expenses
The Income & Expenses page builds your operating statement. Rental income flows automatically from the rent roll. You add additional income sources, operating expenses, and set growth rates for projections.
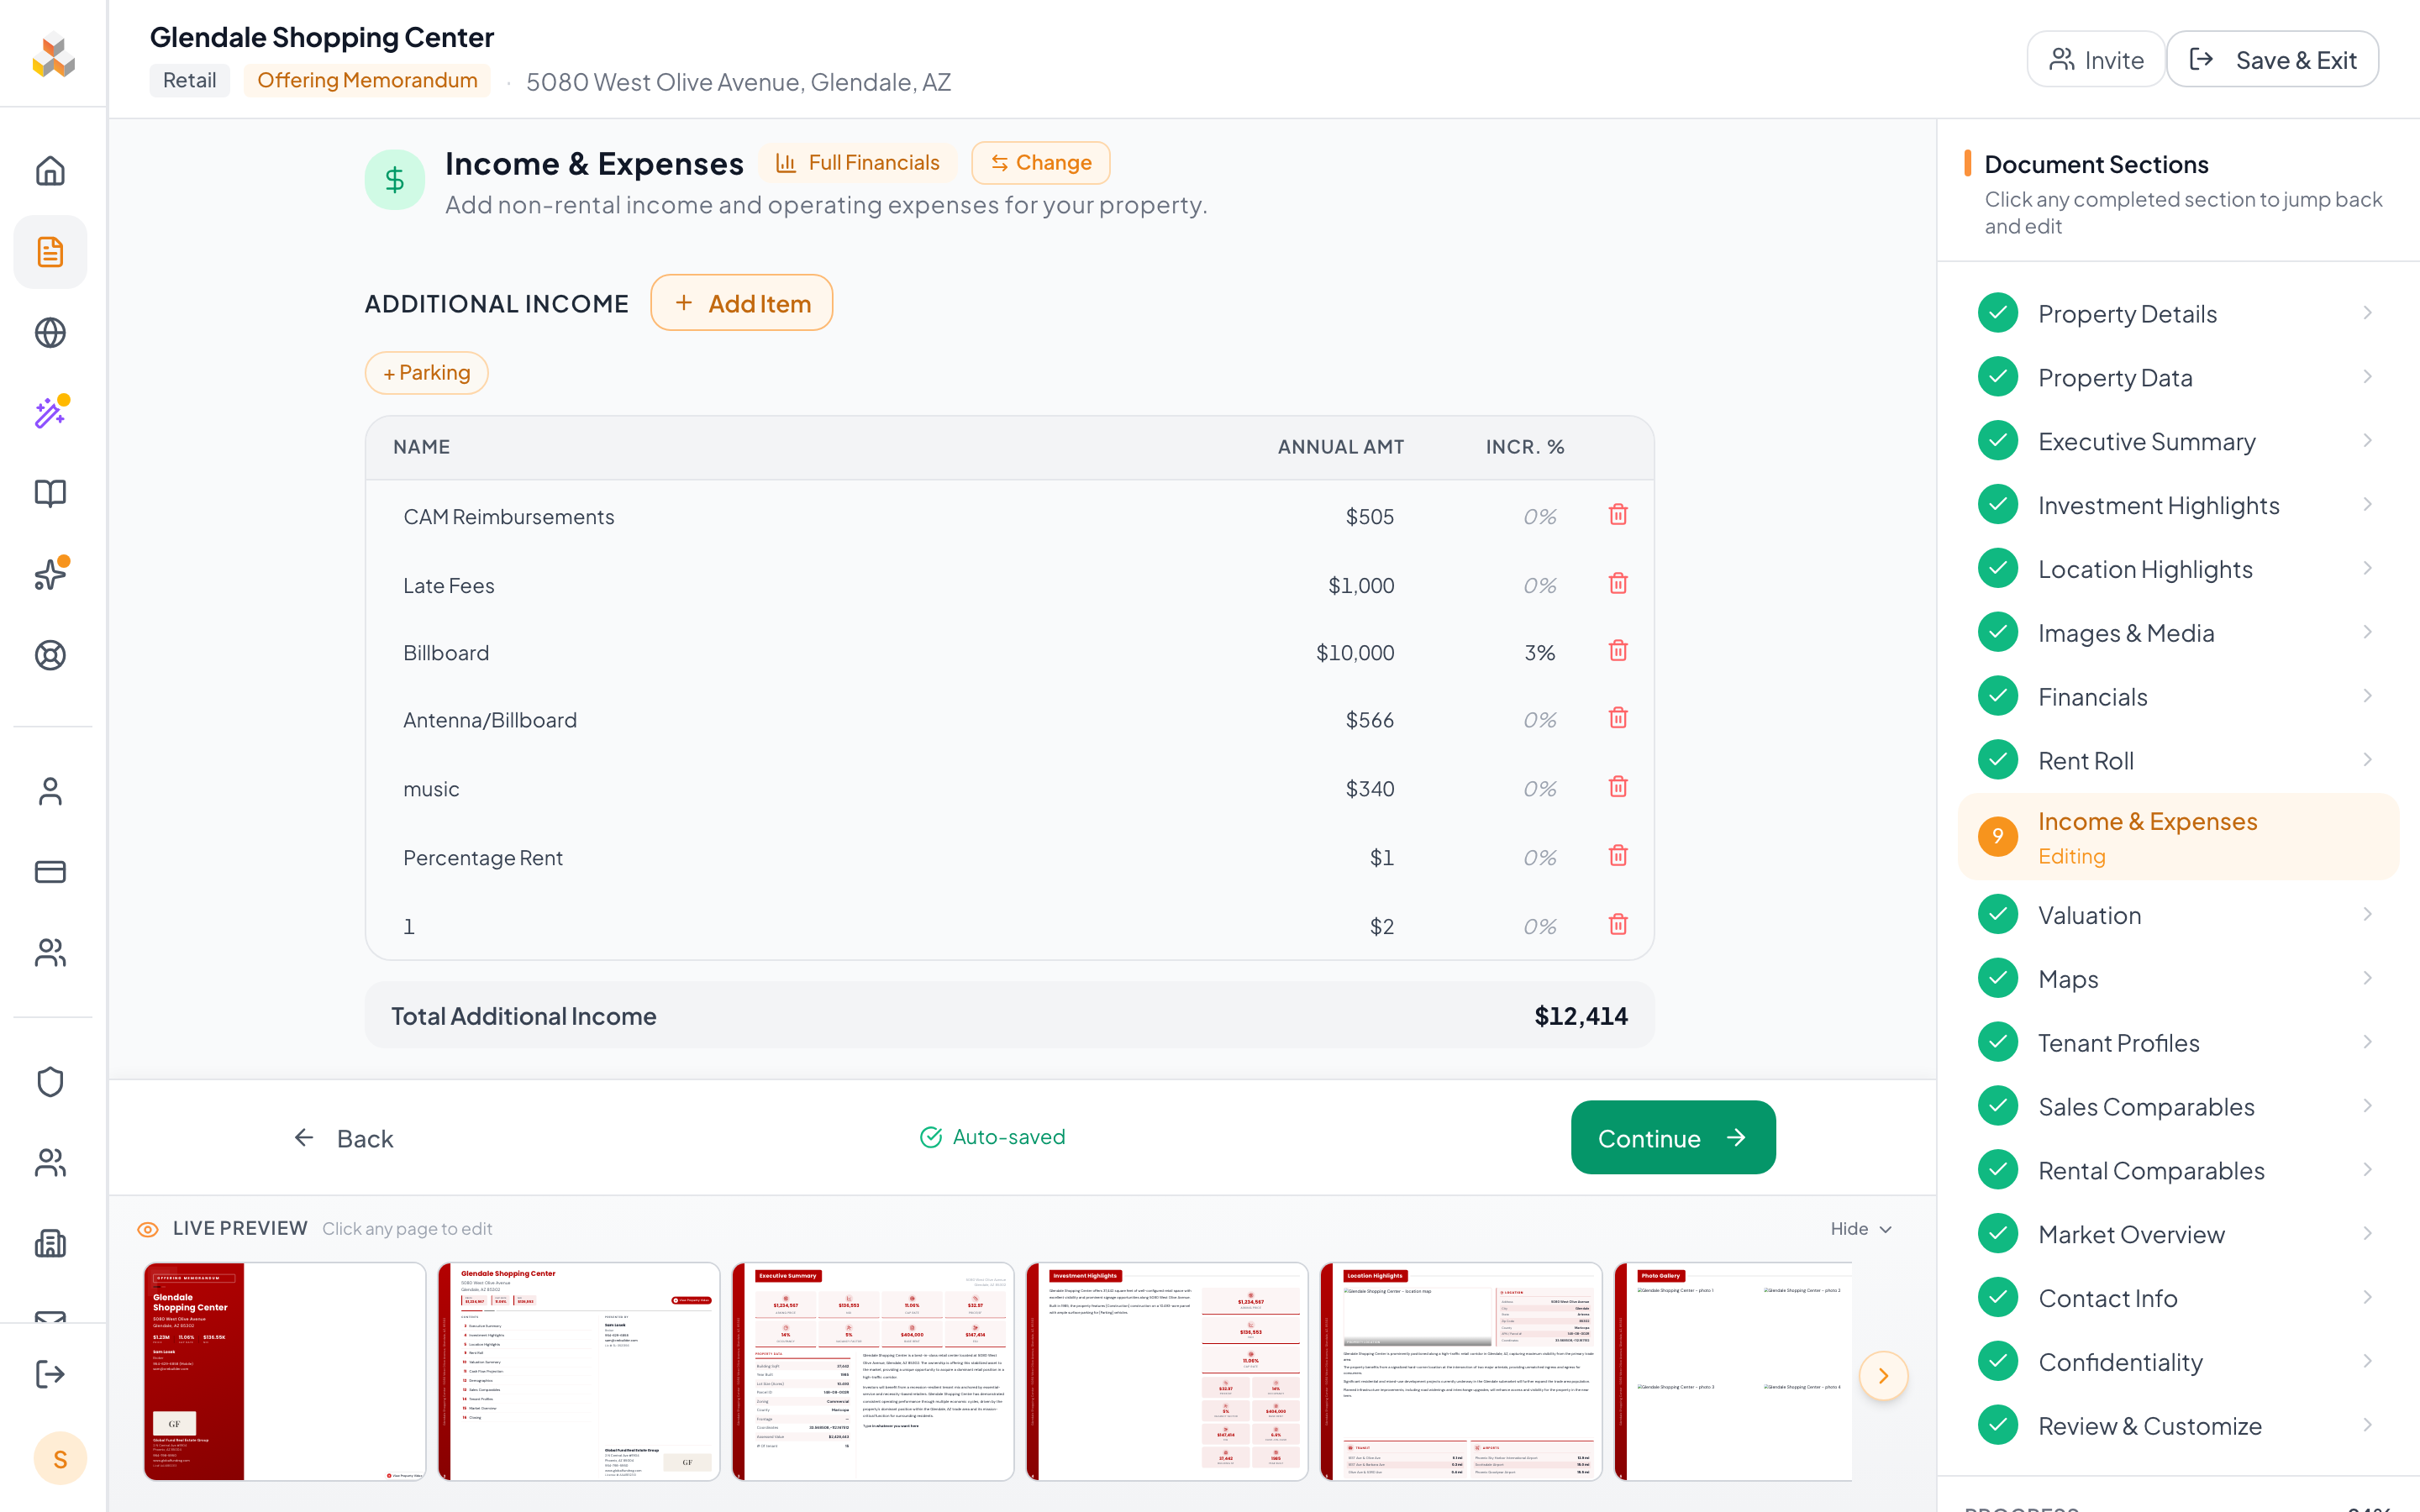
Additional income
Add non-rental income sources beyond base rent. Common items include:
- Parking revenue
- Laundry / vending
- CAM reimbursements
- Storage fees
- Antenna / cell tower lease
Each item has an annual amount and an optional growth rate for projections.
Operating expenses
Default expense categories are pre-populated. You can add, edit, or remove any line item. Typical expense categories include:
Growth rates
Each income and expense item can have its own annual growth rate. For convenience, the Assumptions Panel lets you set a master growth rate that applies to all items at once. Individual overrides take priority.
NOI auto-calculates
Net Operating Income = Total Income - Total Expenses. This updates in real time as you add items and change amounts.
Property Tax can auto-fill from ATTOM data when available. If a tax value is found for your property address, the default Property Tax line item is pre-populated on first load.
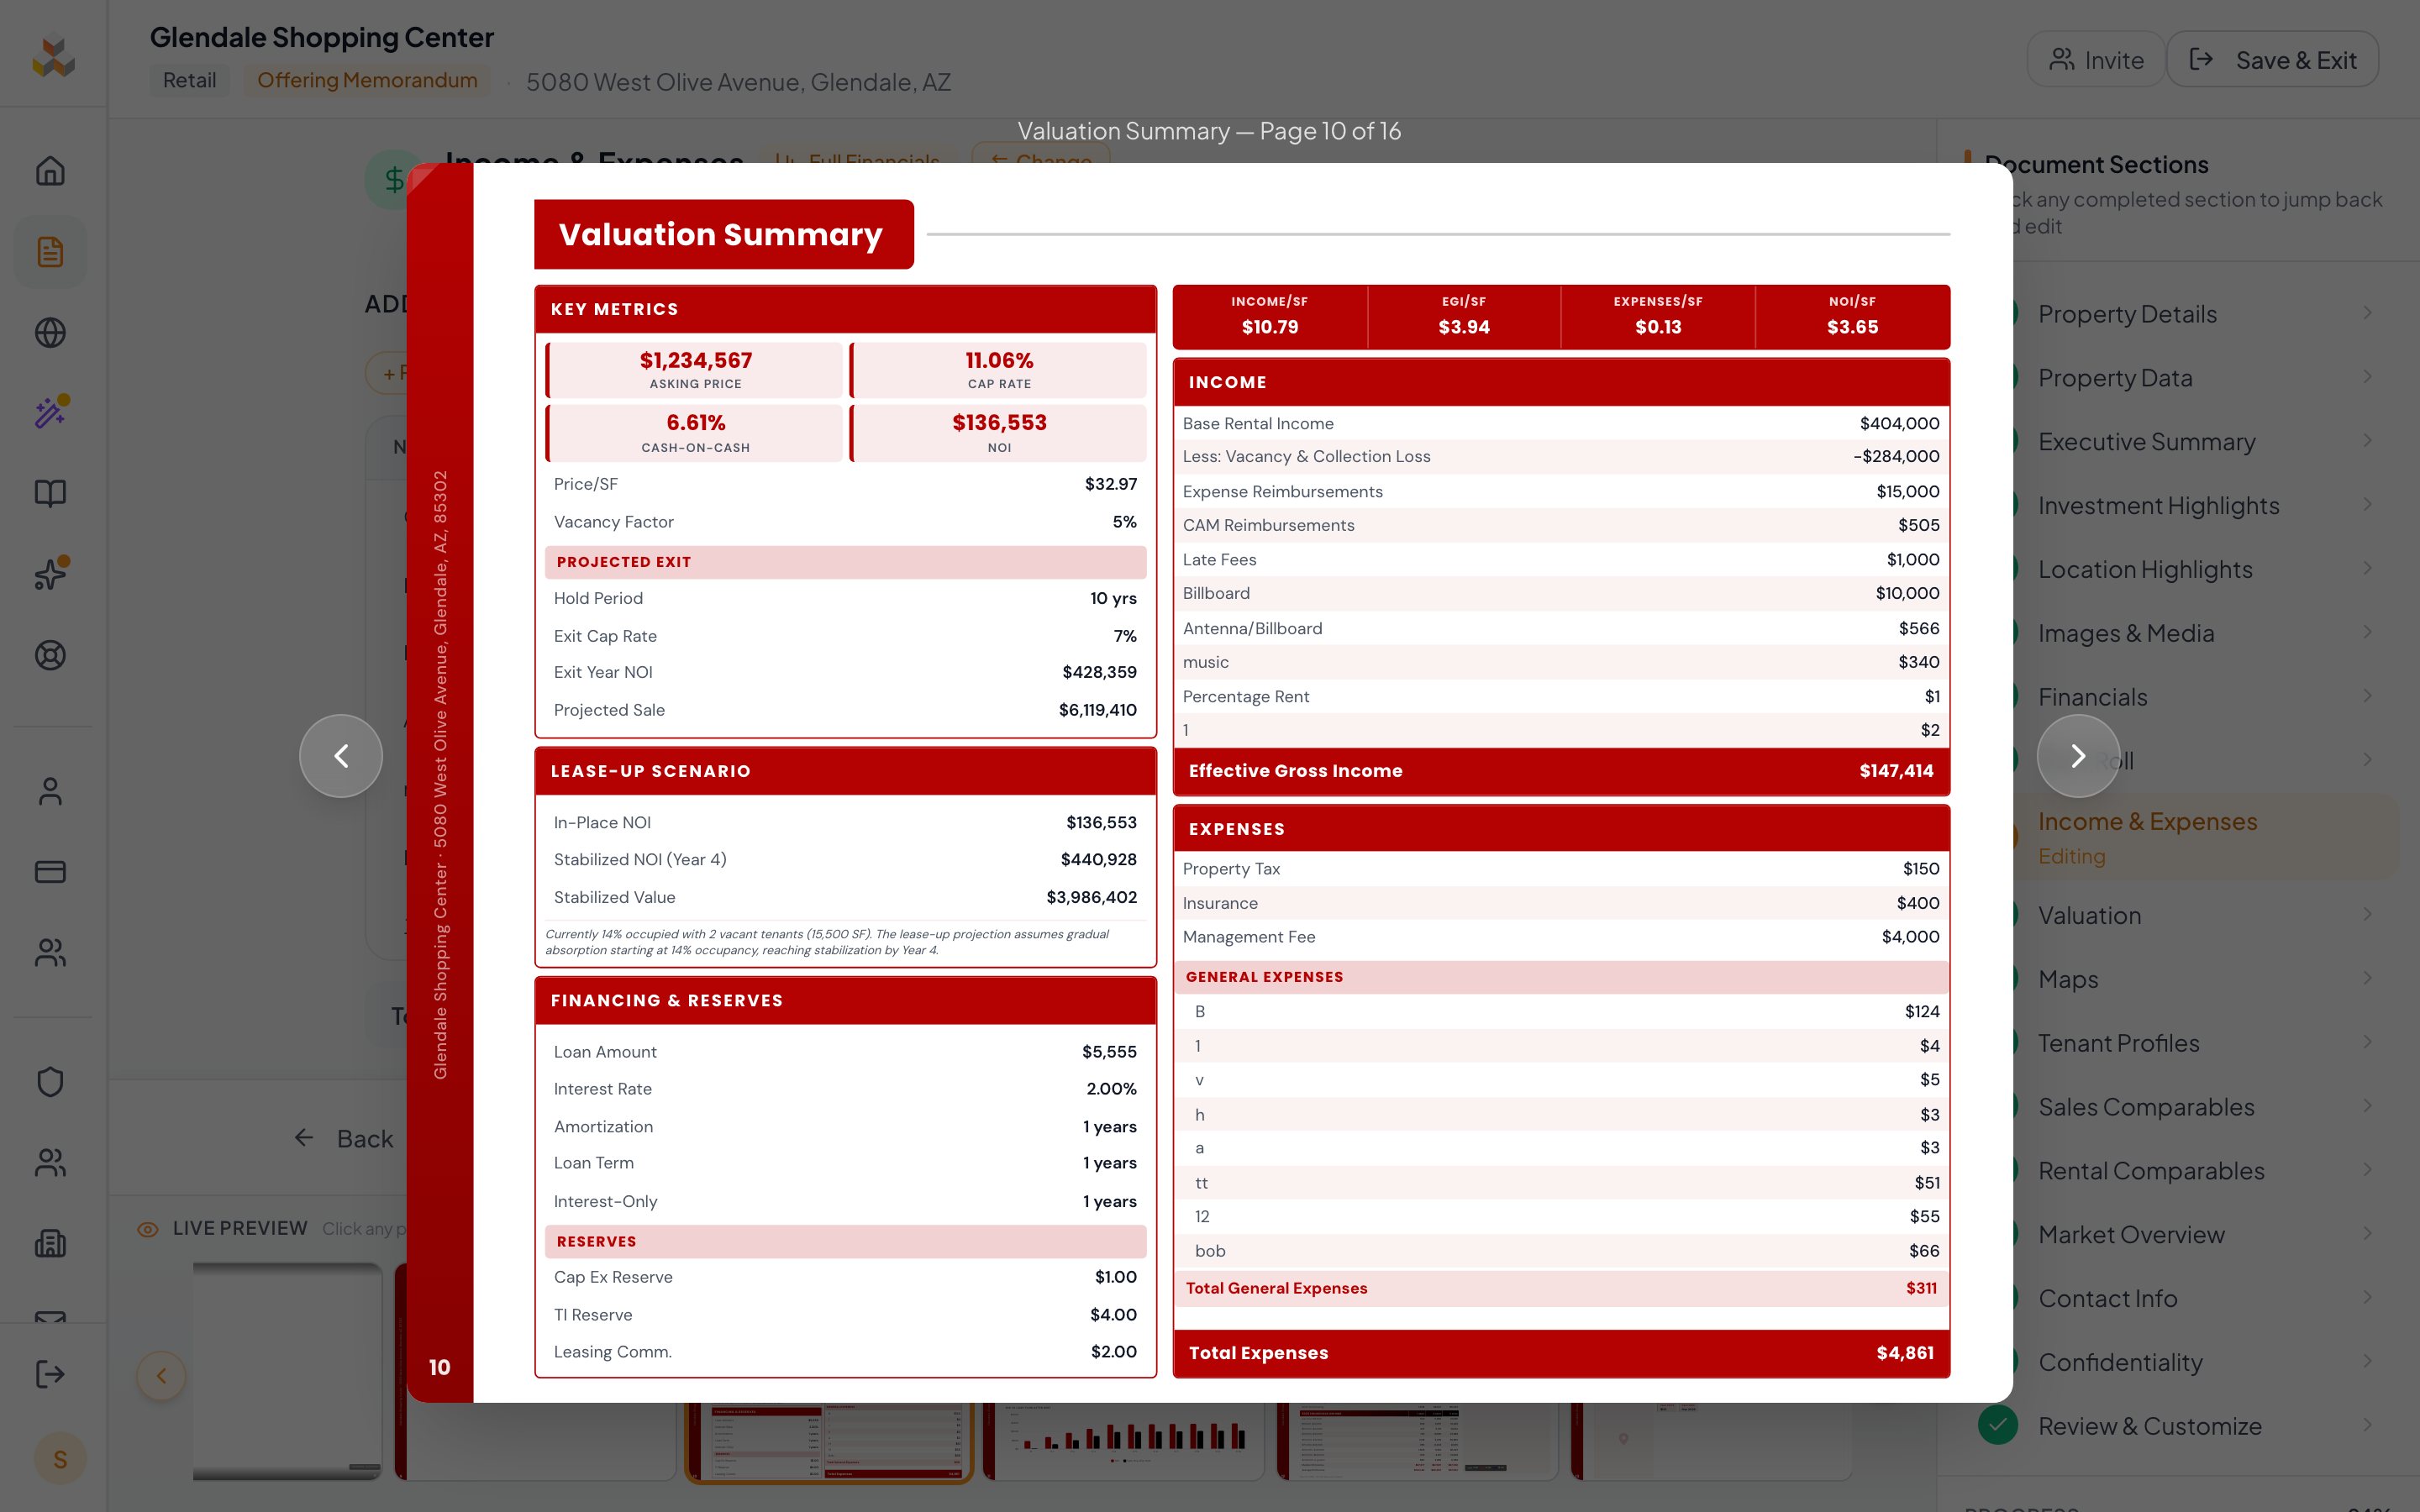
Valuation & Cap Rate
The valuation page calculates investment metrics from your financial data. In Full Financials mode, NOI flows from your rent roll and expenses. In Cap Rate & NOI mode, you enter values directly.
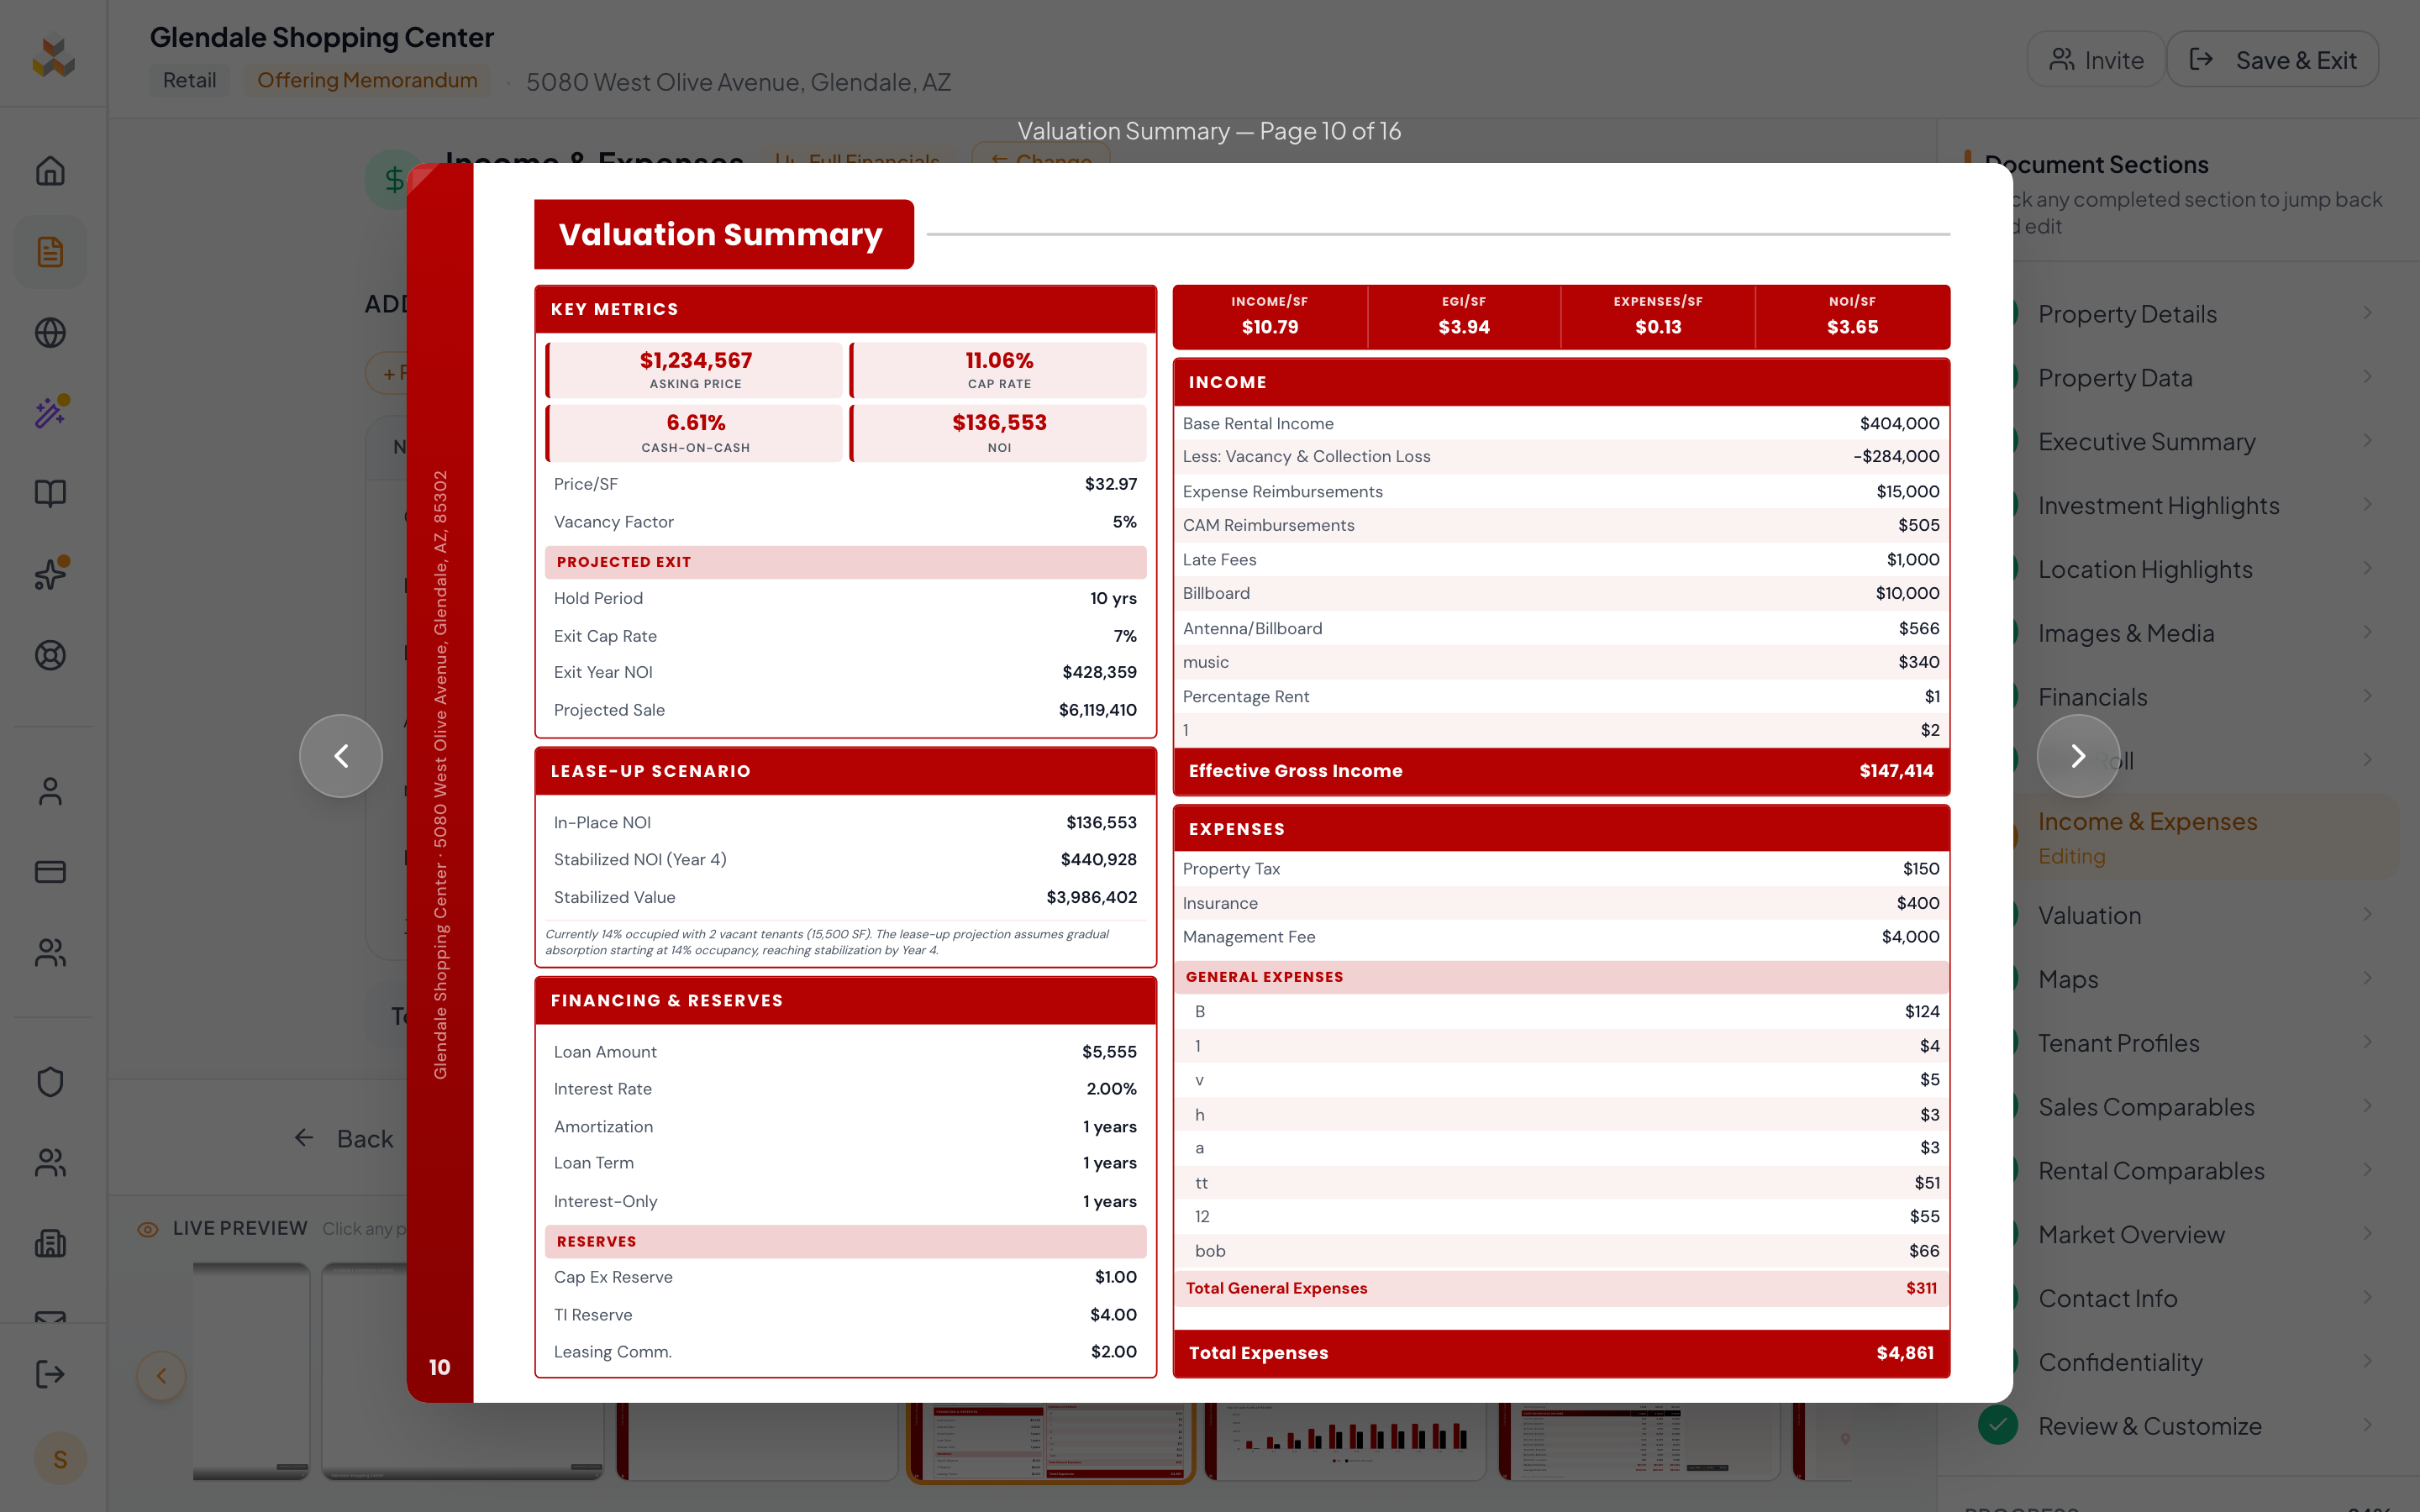
The valuation triangle
Cap Rate, NOI, and Price form a triangle. Enter any two and the third auto-calculates:
Cap Rate
NOI / Price = Cap Rate
NOI
Price x Cap Rate
Price
NOI / Cap Rate
Property-type-specific metrics
The valuation page auto-displays the right metrics for your property type:
| Property Type | Primary Metric |
|---|---|
| Retail / Office / Industrial | Price per SF |
| Multifamily | Price per Unit |
| Hospitality | Price per Key |
| Mobile Home Parks | Price per Pad |
| Land | Price per Acre |
| Self-Storage | Price per Unit |
| Net Lease | Cap Rate + Lease Term |
In Full Financials mode, the NOI on the valuation page comes from your cash flow projection's In-Place year. This is the single source of truth for NOI across the entire document.
Sales & Rental Comparables
Comparables support your valuation with market evidence. Add comparable sales and rental comps to help buyers and underwriters validate your pricing.
Sales comparables
Add recent sales of similar properties. For each comp, enter:
- Property address and name
- Sale price and date
- Cap rate
- Building size (SF) and Price/SF (auto-calculated)
- Optional photo upload
Rental comparables
Add comparable lease rates from nearby properties to contextualize your rent roll. Same field set as sales comps but with lease rate data instead of sale price.
3 to 5 comps is the sweet spot. Too few looks thin; too many dilutes the narrative. Pick the most relevant recent transactions.
There is no hard limit on comparables, but keep in mind that each comp adds a row to the formatted table in your PDF. More than 8-10 can make the page look crowded.
Cash Flow Projections
In Full Financials mode with a Cash Flow rent roll type, CREBuilder generates a multi-year pro forma projection. The projection uses your rent roll, income, expenses, and growth rate assumptions to model future performance.
Assumptions panel
The Assumptions Panel on the Valuation page controls the projection parameters:
Growth Rates
Master income and expense growth rates applied across all line items. Individual items can override.
Vacancy & Credit Loss
Percentage deducted from gross income to account for turnover, collection loss, and vacancy periods.
Loan Assumptions
Optional debt service parameters (loan amount, interest rate, amortization) for leveraged return calculations.
Exit Assumptions
Exit cap rate and hold period for IRR and equity multiple projections.
What the cash flow shows
The generated projection table includes:
- Gross Potential Income — total rent at full occupancy
- Vacancy & Credit Loss — deduction based on your assumption
- Effective Gross Income — after vacancy deduction plus additional income
- Total Operating Expenses — all expense categories with growth
- Net Operating Income — Year 1 is in-place NOI; Years 2-10 are projected NOI based on your growth assumptions. The Year 1 number flows through to the cover, exec summary, and valuation pages.
- Debt Service — annual loan payments (if loan assumptions are entered)
- Cash Flow After Debt Service — net cash to equity
- Cash-on-Cash Return — annual cash flow divided by equity invested
Single source of truth
Year 1 NOI from the cash flow projection is the authoritative in-place value used on the valuation page, investment key metrics, and cover page. Years 2-10 are projected NOI based on your growth assumptions. All financial metrics stay in sync automatically.
Growth rates, expenses, additional income, vacancy assumptions, and tenant changes all invalidate the cash flow projection automatically. The table updates in real time as you make changes anywhere in the financial workflow.
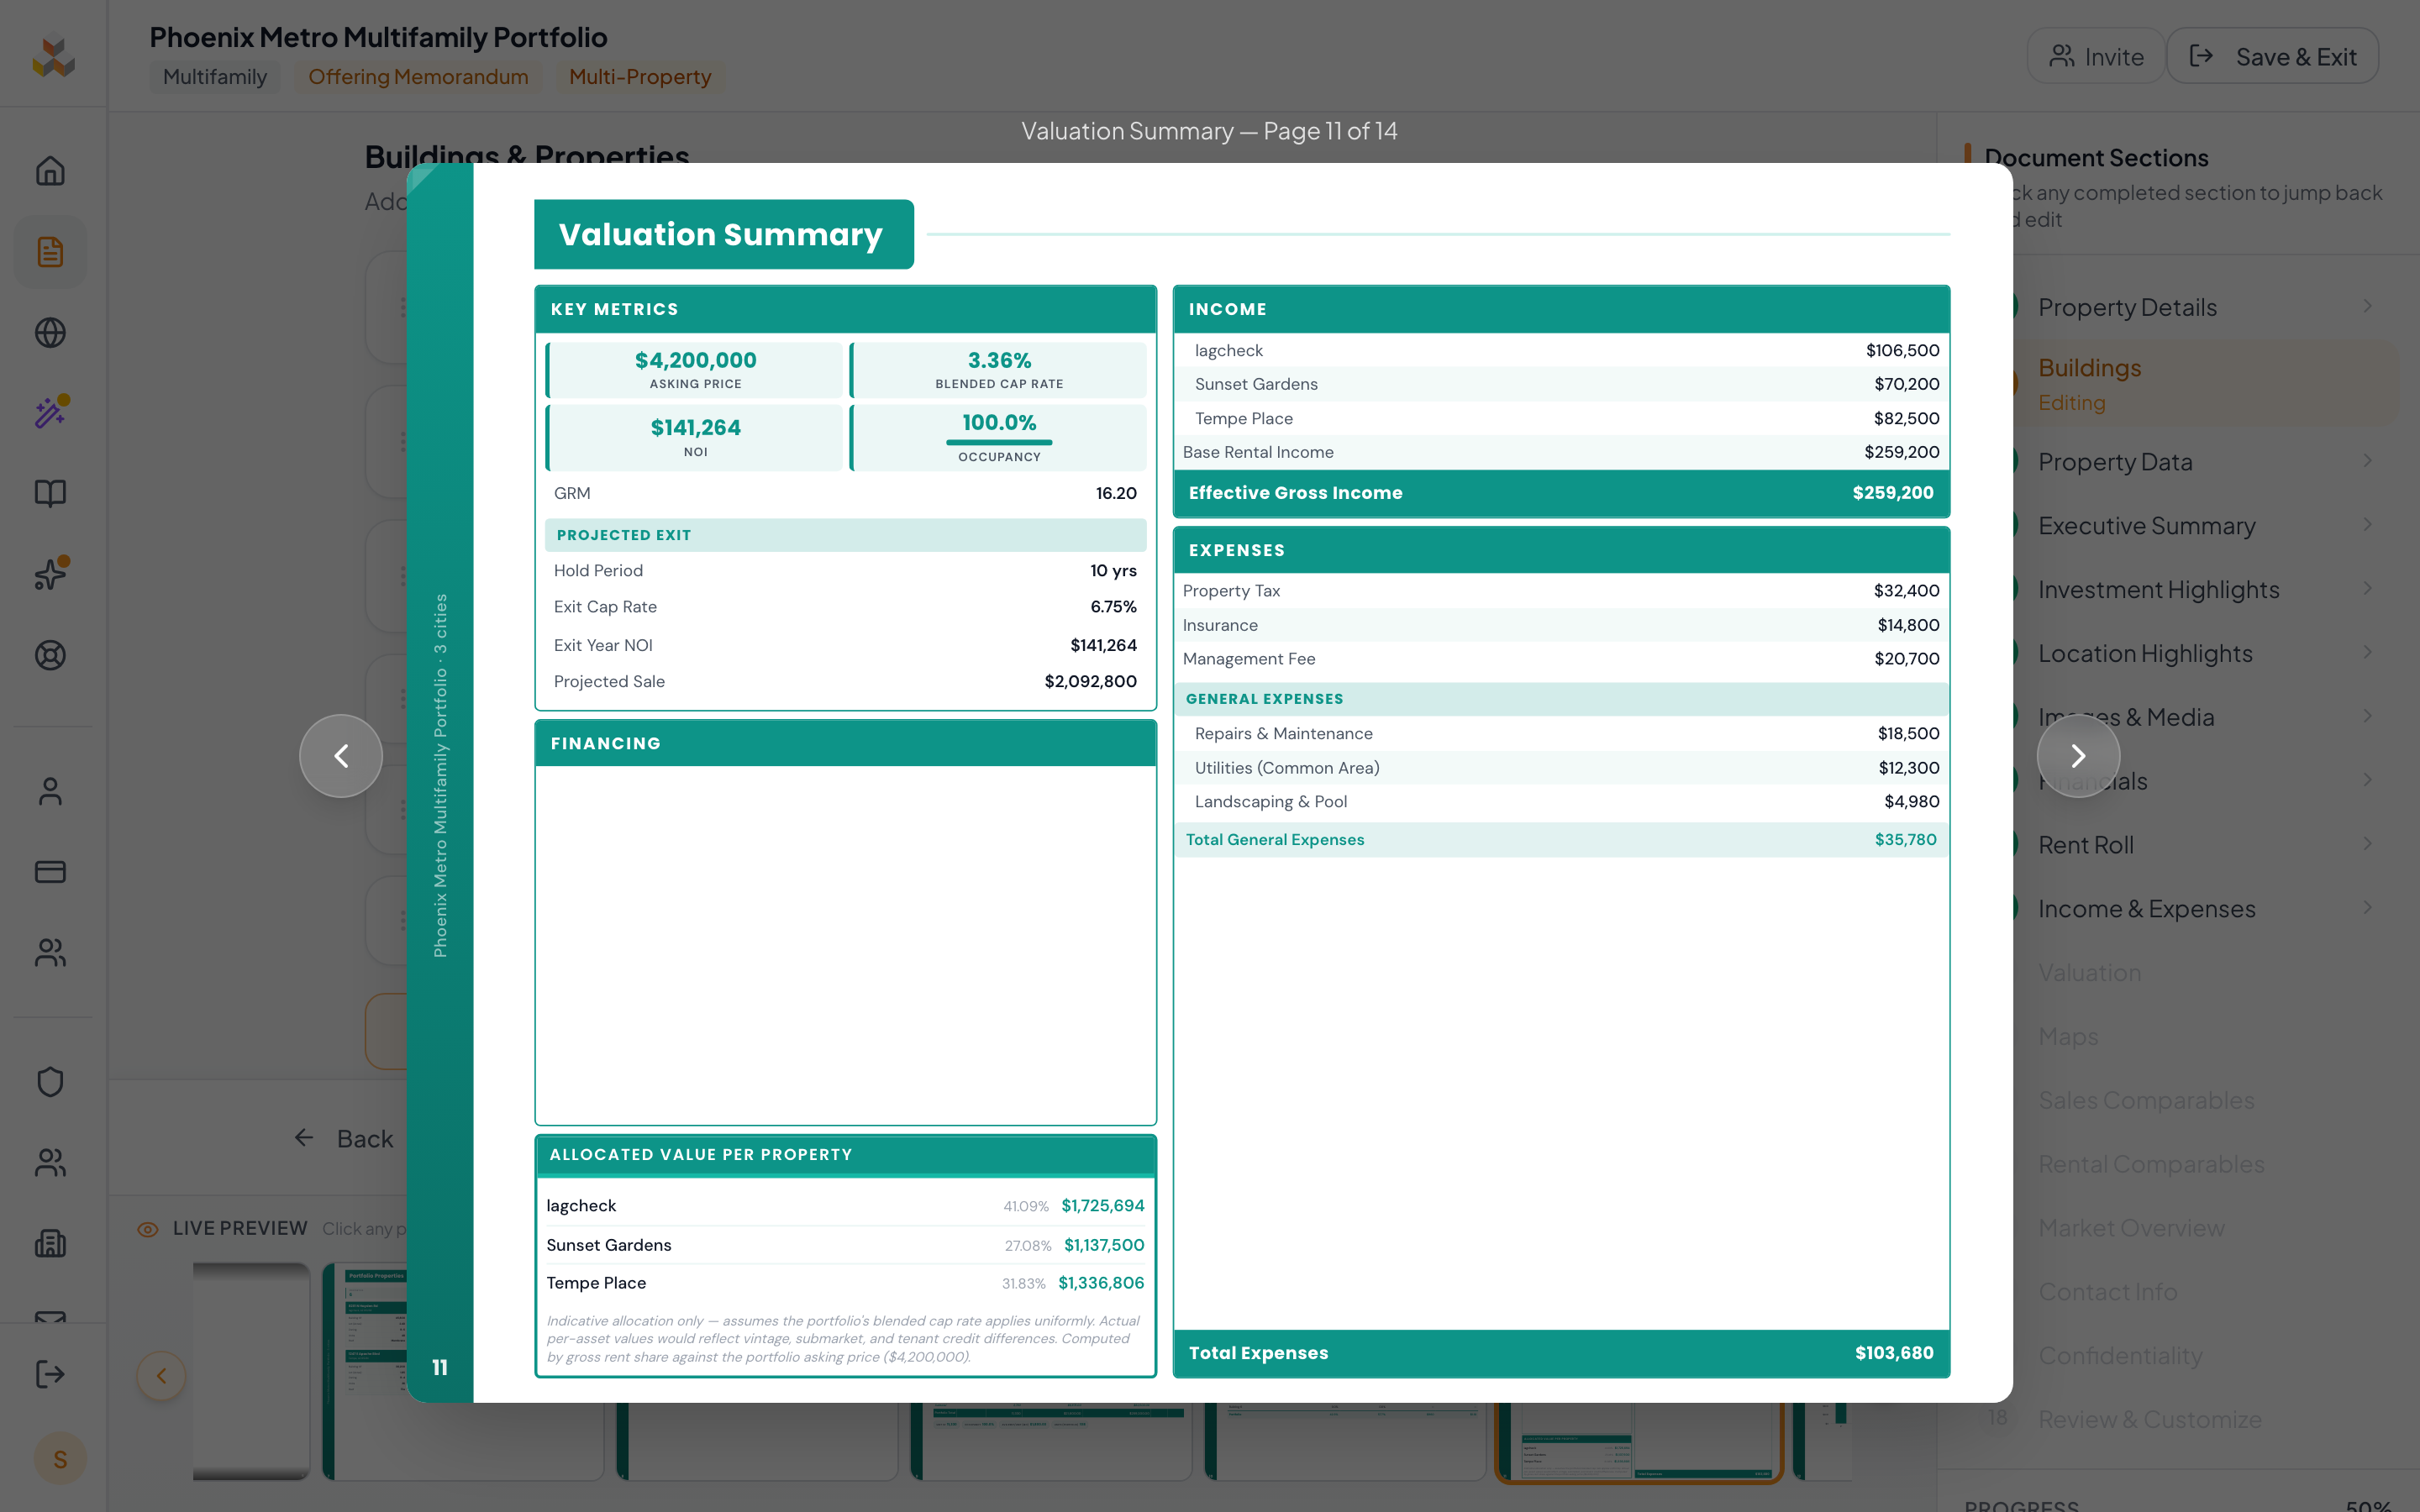
Portfolio Financials
Multi-property documents (portfolios, multi-building campuses, land assemblages) reshape the entire financial workflow. Each building carries its own rent roll, expenses, and additional income — and CREBuilder rolls them up into portfolio-level metrics that appear throughout the document.
Per-building data scoping
- Rent Roll — each building gets its own tenant/vacancy table inside an expandable accordion. The portfolio total footer aggregates SF and annual rent across all buildings.
- Income & Expenses — Additional Income and Operating Expenses are scoped per-building via a Building Selector at the top of the step. Each building rolls into its own NOI.
- Property Data — every building has its own Year Built, Lot Size, Building SF, custom fields, and auto-fill state.
- Valuation — Selling Price entered at the doc level. Per-building NOI determines how the selling price is allocated across buildings on the Valuation Summary page.
Portfolio output pages
Portfolio Properties
Per-building cards summarizing each property with key metrics. Comes before Property Summary in the rendered document.
Multi-marker Portfolio Map
Replaces the single-property location map. Drops a numbered pin at each building's address with a legend mapping pins to property names.
Weighted Average Cap Rate (WACR)
Aggregate cap rate across all buildings — sum of all building NOIs / total selling price. Appears on the cover, exec summary, and investment highlights for portfolios.
Allocated Value Per Property
On the Valuation Summary page, a per-building breakdown showing each property's allocated share of the total selling price (proportional to its NOI contribution).
Portfolio Financial Summary
A dedicated PDF page (for OMs and Sales Teasers) with per-building columns for income, expenses, and NOI, plus a Total column at the right.
Campus vs Portfolio labeling
Multi-building (same site) docs render "Building Financial Summary"; scattered portfolios render "Portfolio Financial Summary". Same page, contextual heading.
Want the full multi-property walkthrough?
The Multi-Property & Portfolios guide covers the Buildings step, single-vs-multi/campus-vs-portfolio choices, Building Selector behavior, and how each output page renders for portfolio docs.