Document Editor
Property details, content sections, and market data
The document editor is where you build your CRE marketing materials step by step. This guide covers every section from property details through market demographics, including the AI content suggestions, auto-populated transit data, and draggable key facts.
Property Details
The first step in every document. Your property name becomes the marketing headline on the cover page.
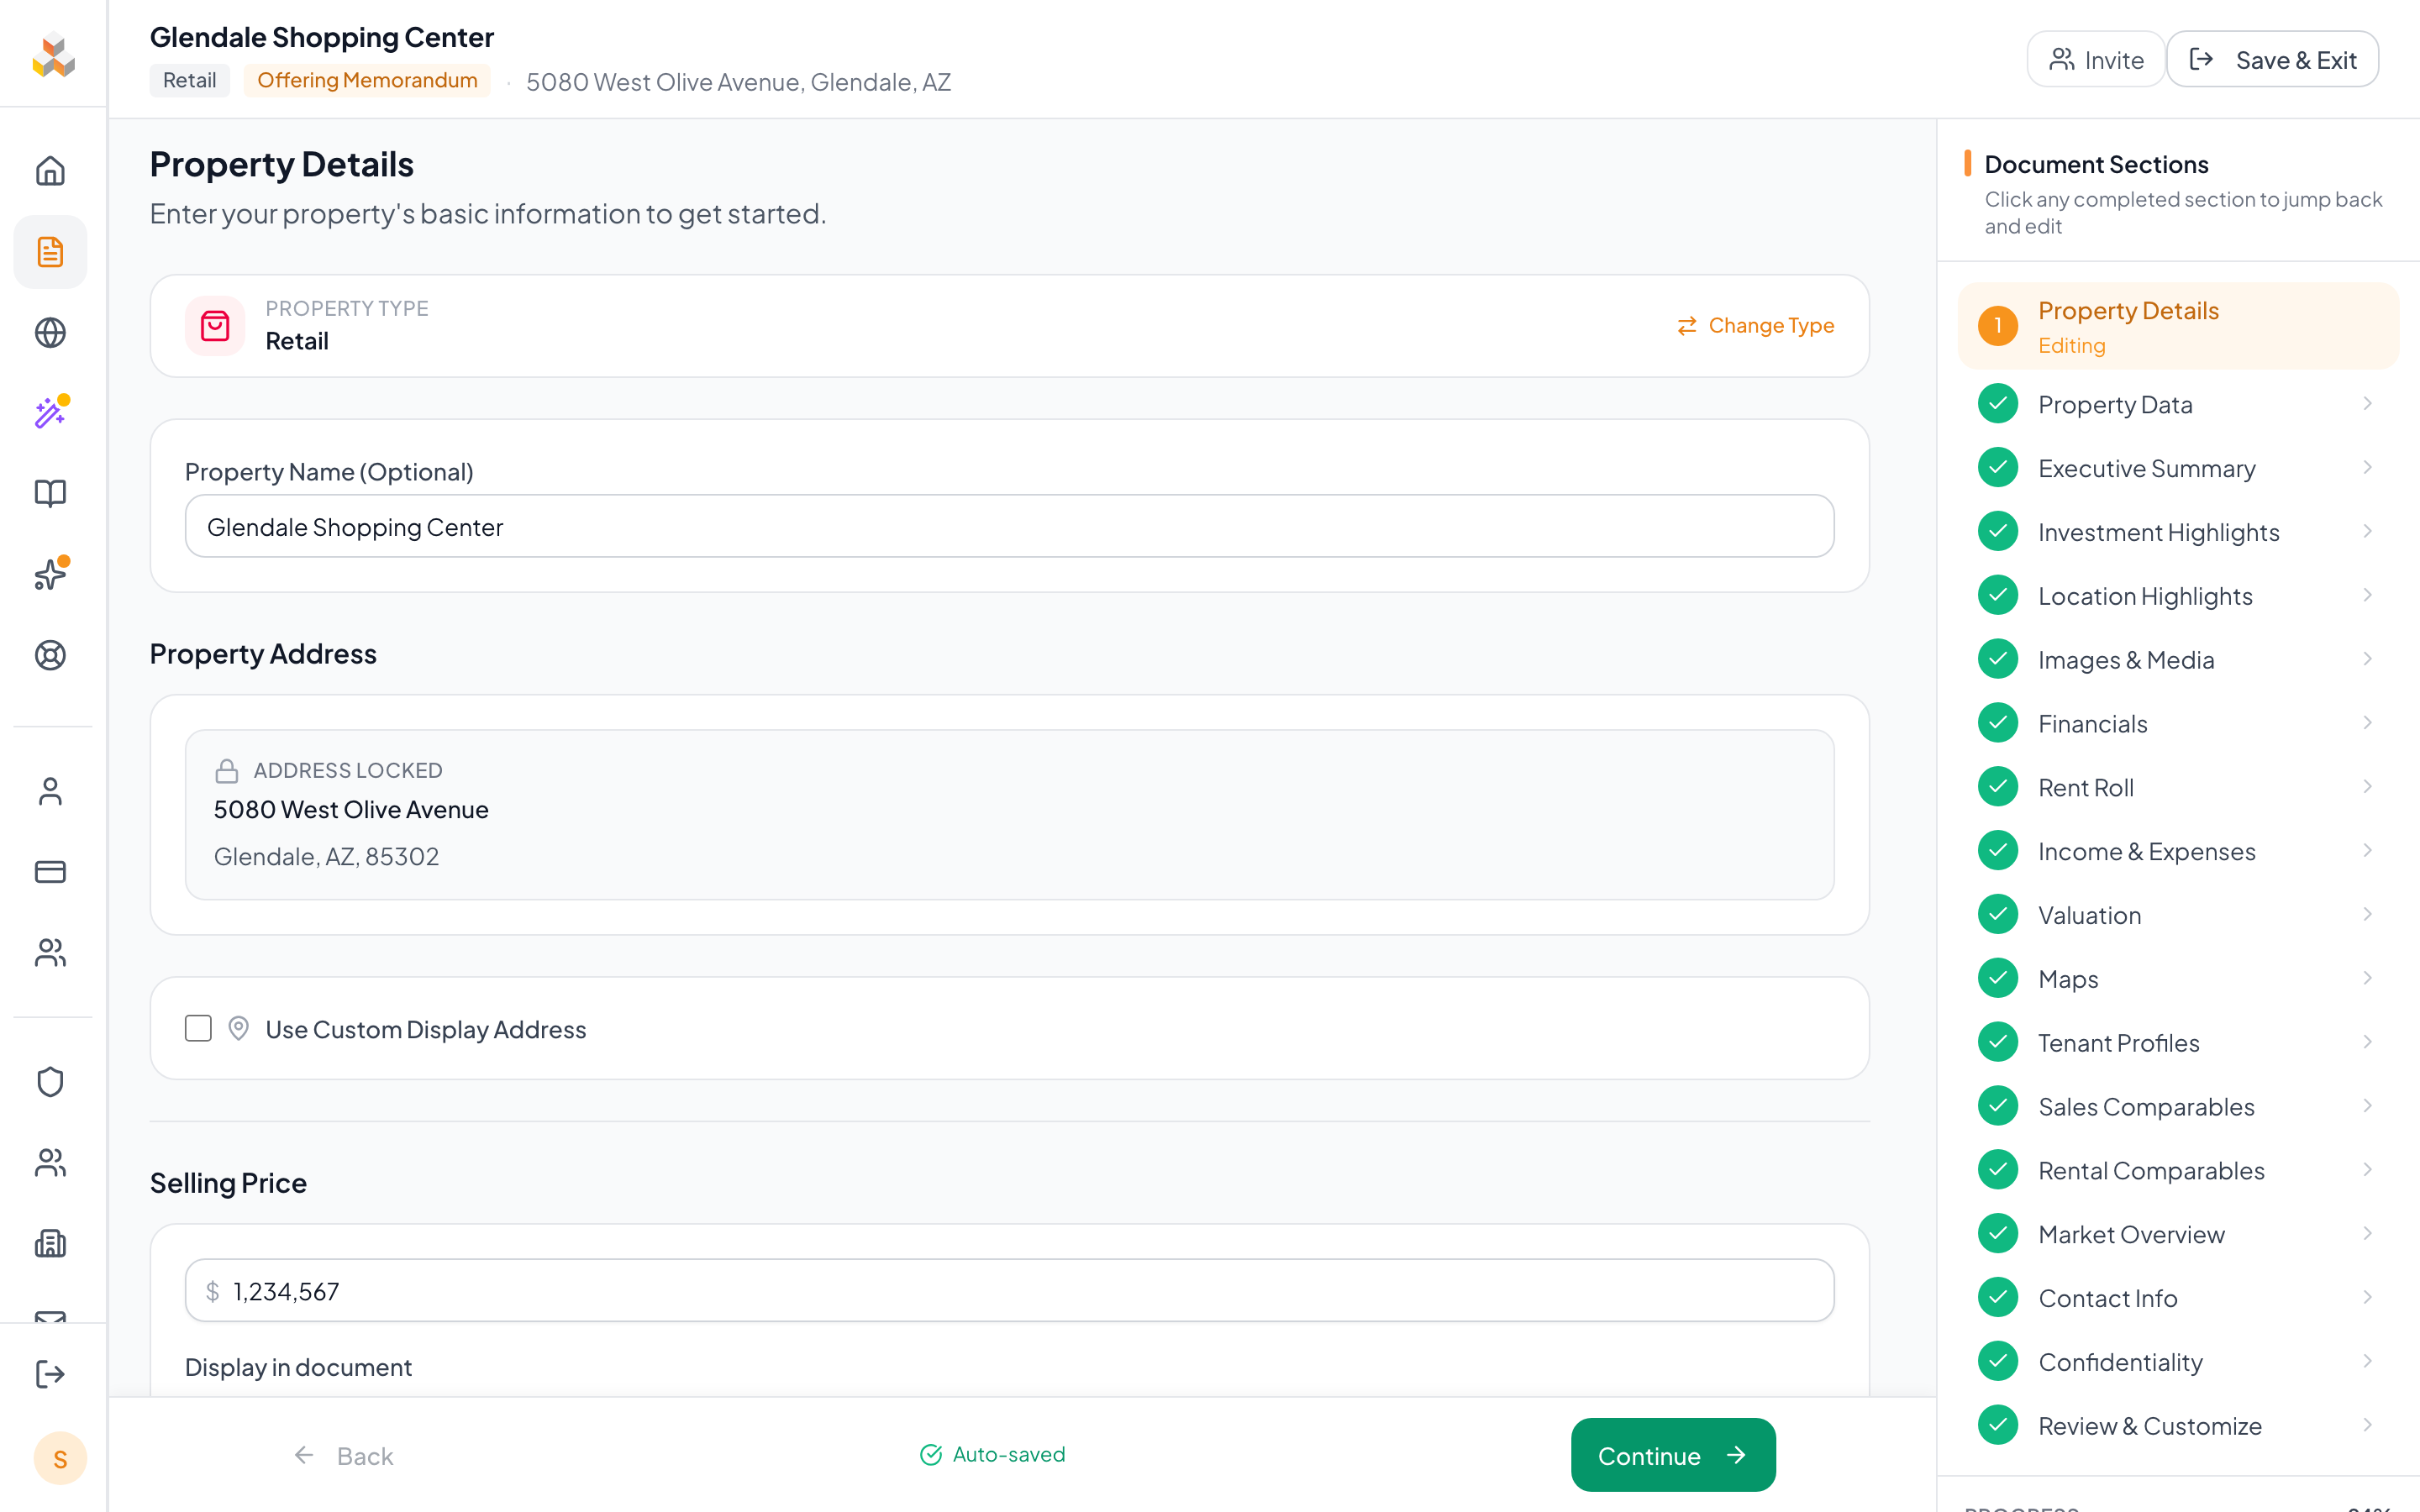
- 1Property Name
- 2Address Autocomplete
- 3Selling Price
- 4Wizard Sidebar
Property Name
The marketing name that appears on your cover page and throughout the document. Use the name buyers will recognize (e.g., 'Sunset Plaza Shopping Center').
Address Autocomplete
Start typing the street number and Google Places fills in the city, state, ZIP, and coordinates automatically. Coordinates power the map builder and demographic lookups.
Custom Display Address
Toggle the custom address checkbox to override the display address shown on the cover without changing the underlying coordinates.
Selling Price
Set the asking price, choose 'Negotiable', or hide the price entirely. Cap rate and NOI auto-calculate from each other when financials are included.
Address autocomplete works best when you start with the street number. Once selected, city, state, ZIP, and lat/lng populate instantly and cannot be edited individually to keep data consistent.
Property Data
Building metrics that appear in your document's property summary. Fields vary by property type.
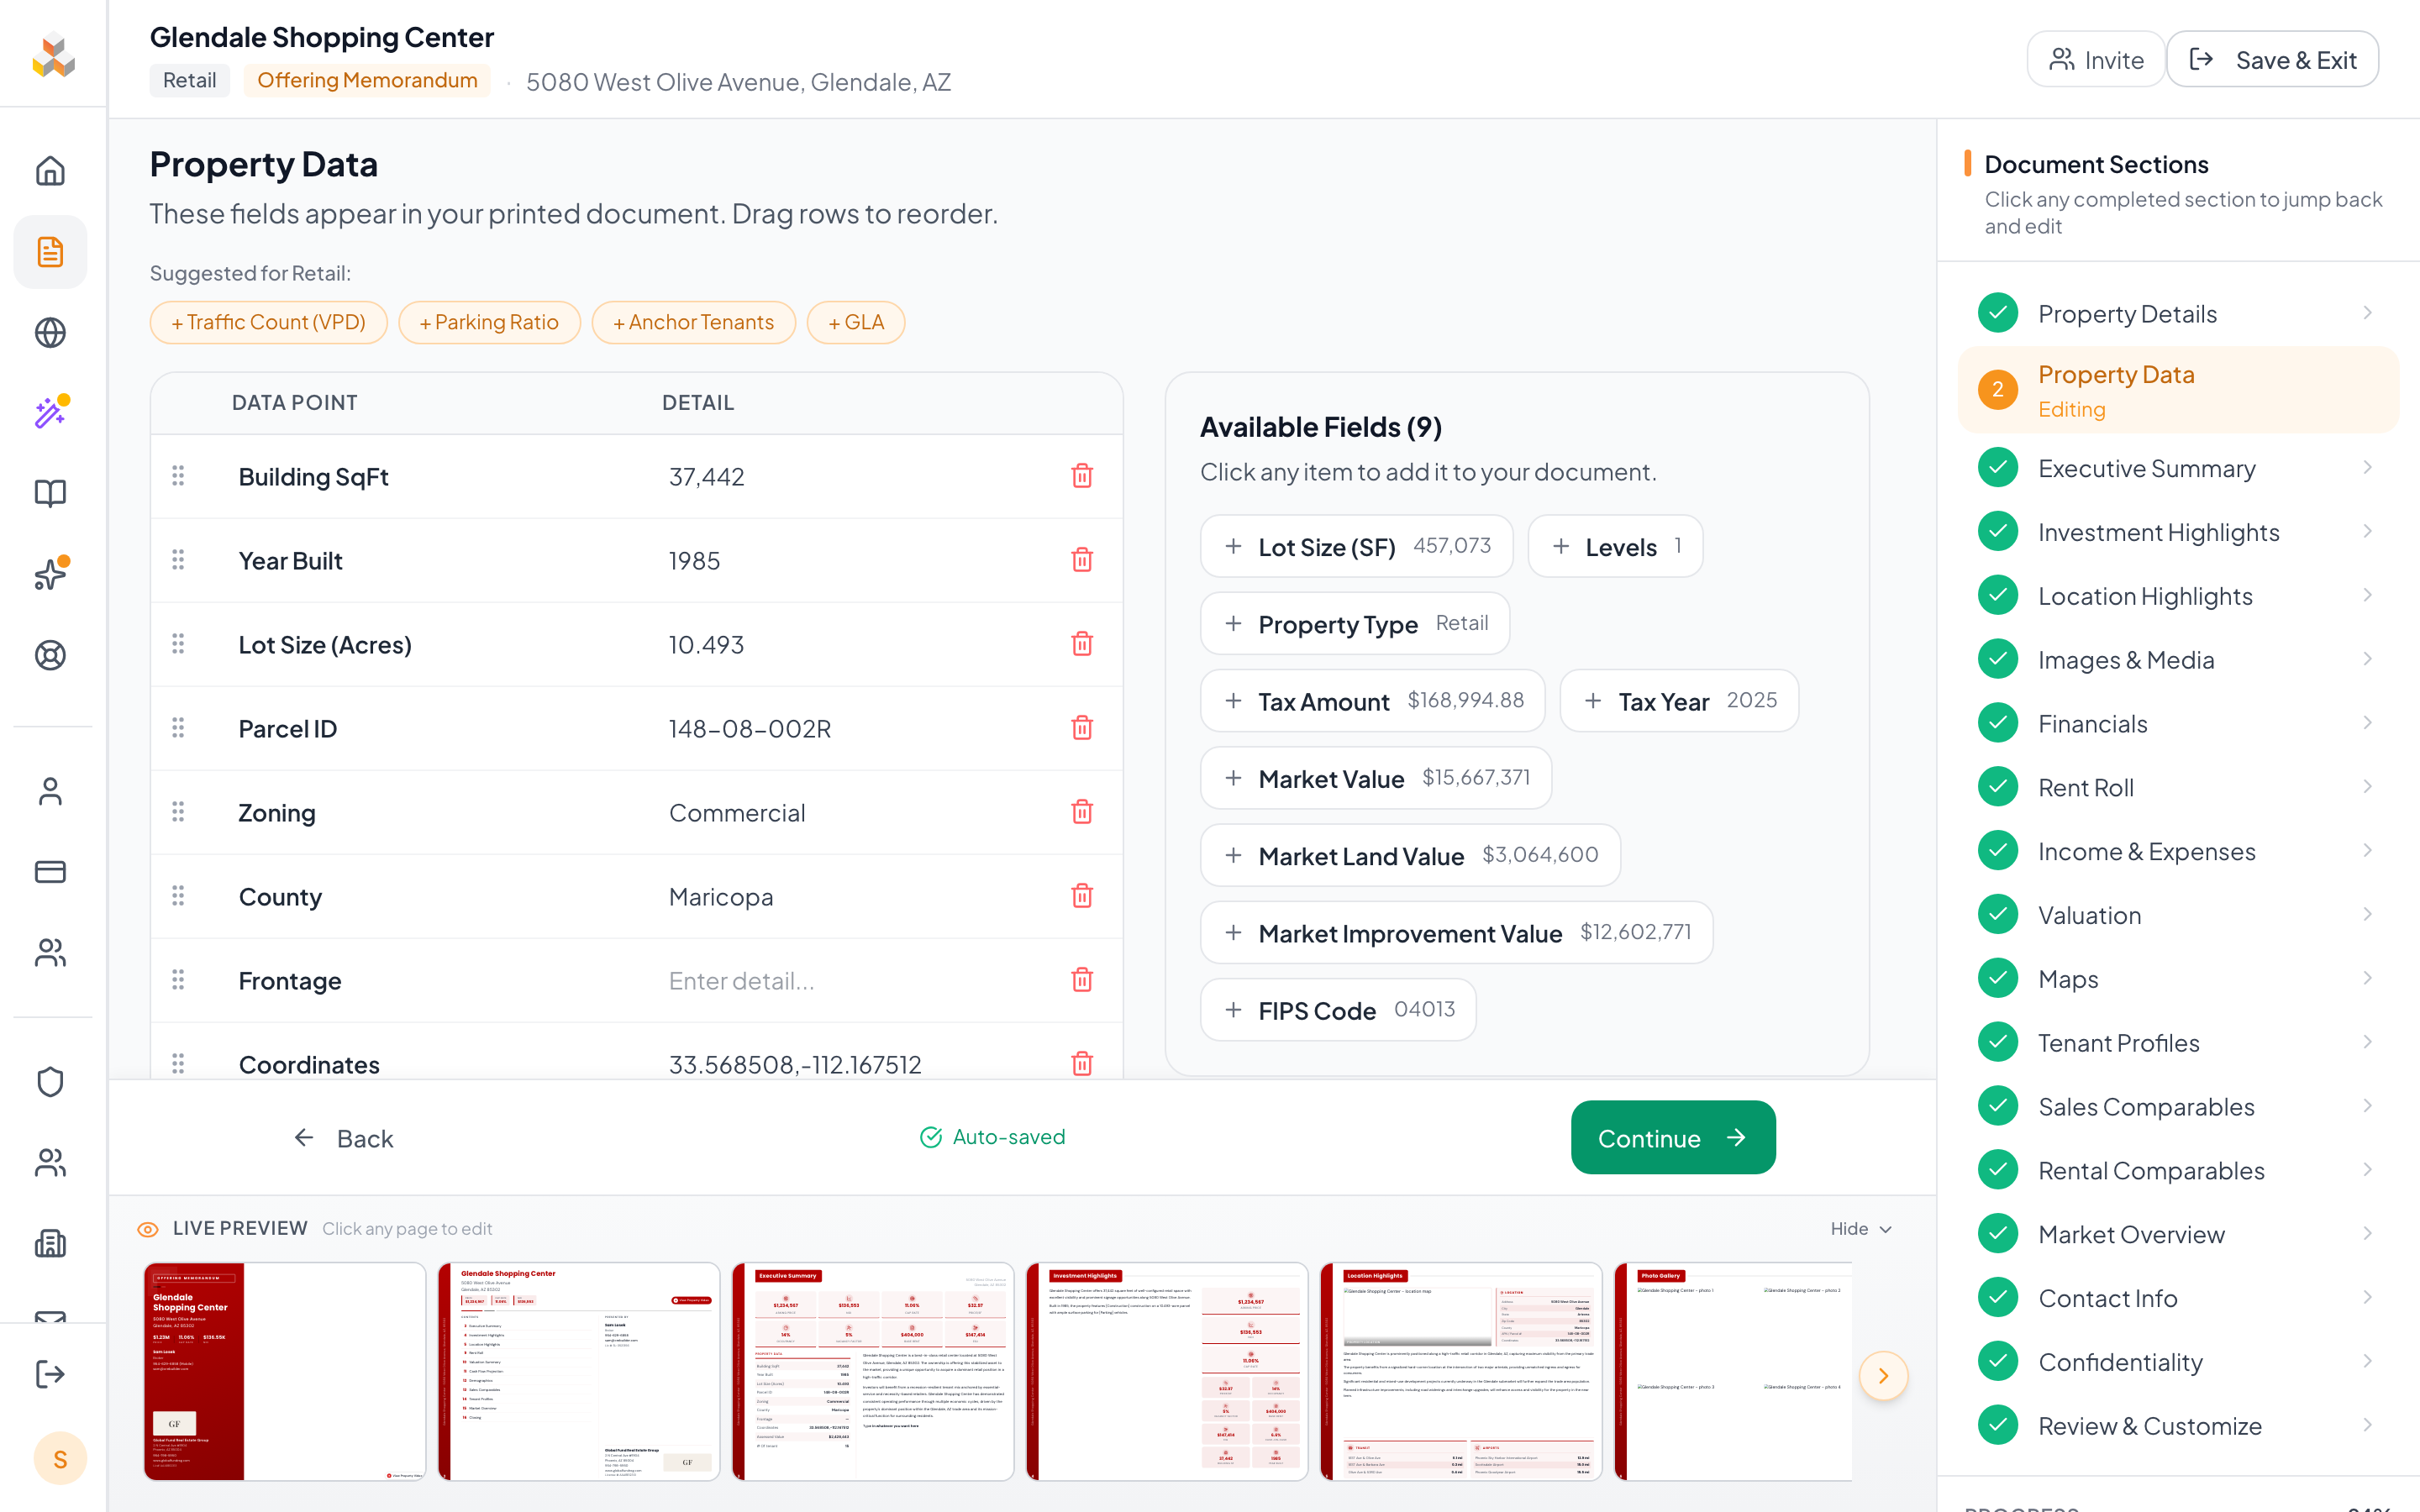
- 1Suggested Fields
- 2Data Table
- 3Add Custom Field
How it works
- Auto-populate from public records -- when you first visit this page, CREBuilder automatically fetches property data (year built, lot size, building SF, zoning, parcel ID, etc.) from ATTOM public record databases.
- Suggested fields -- property type-specific suggestions appear as clickable pills above the table. Retail shows Traffic Count, Parking Ratio, Frontage; Industrial shows Clear Height, Dock Doors, Column Spacing.
- Drag to reorder -- grab the grip handle on any row to change the display order. The order here matches the order in your printed document.
- Available Fields bank -- extra data points from public records appear in a sidebar panel. Click any to add it to your active table.
Property type-specific suggestions
You can add completely custom data points with the "Add Custom Data Point" button at the bottom of the table. Both the label and value are editable.
Content Editing
Rich text editors for each narrative section of your document. Bold, italic, underline, lists, and more.
- 1AI Suggestions
- 2Rich Text Editor
- 3Category Tabs
- 4Save Status
Formatting toolbar
The editor supports Bold, Italic, Underline, bullet lists, numbered lists, hyperlinks, undo/redo, and keyboard shortcuts (Ctrl+B, Ctrl+I, Ctrl+U).
Content sections
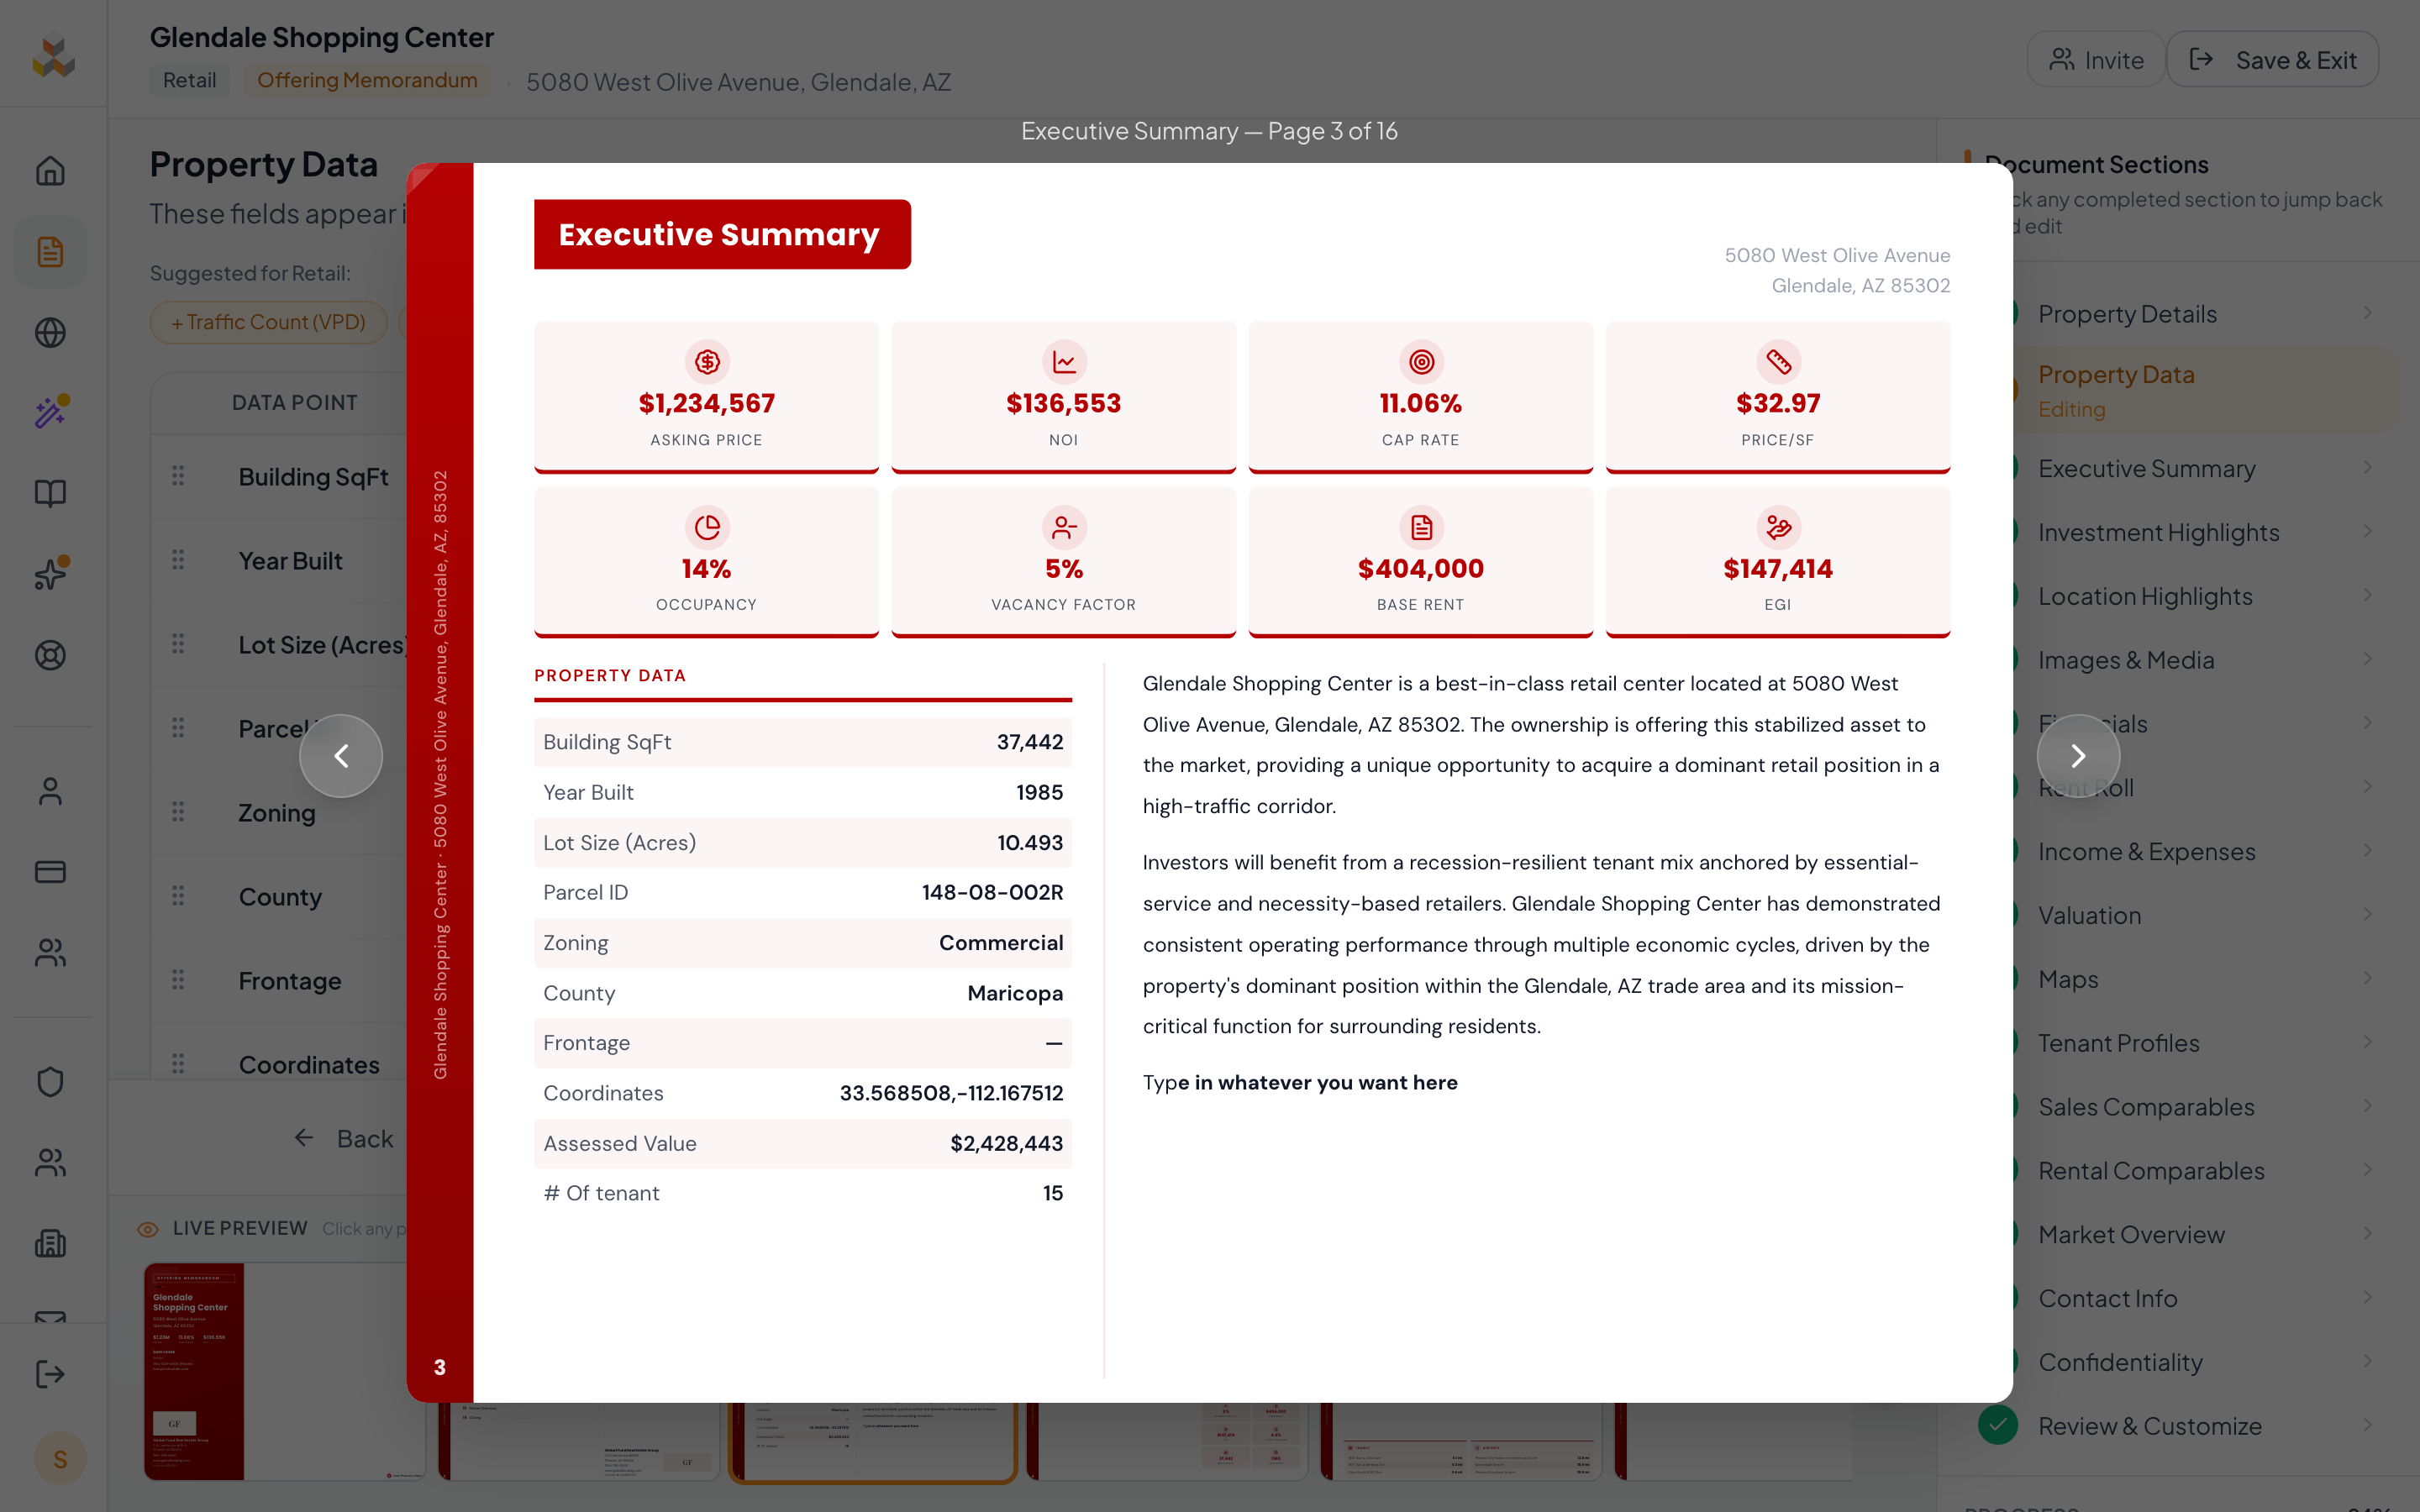
Executive Summary
The opening narrative -- an overview of the investment opportunity. Appears as the first content page after the cover.
Investment Highlights
Key financial advantages, value-add opportunities, and market positioning. Rendered as stylized bullet points.
Location Highlights
Neighborhood context, nearby amenities, traffic counts, and area demographics.
Property Highlights
Physical features, recent renovations, and unique selling points of the building itself.
Property Overview
General property description -- building history, tenant mix overview, and property characteristics.
Content Suggestions
AI-generated paragraph suggestions personalized to your property context. Click any suggestion to insert it.
How AI Suggestions work
Personalized to your property
- Suggestions are generated from your property context -- property name, address, type, and building data you have entered are interpolated into professionally written paragraphs.
- Content is organized into category tabs (e.g., Property Features, Location & Demographics, Investment Thesis). Each tab shows a count badge.
- Click any suggestion card to instantly insert it into the editor at the cursor position. The paragraph is inserted as formatted HTML.
- After inserting, you can freely edit the text -- suggestions are a starting point, not locked content.
Sales Teaser note: Investment Highlights and Location Highlights are merged into a single "Property Highlights" section with suggestions from both categories combined.
Multi-property docs: Suggestions also work for portfolio and multi-building documents. When the document-level property type is empty (which it is for portfolios), the panel falls back to the building's property type so you still get tailored content.
On mobile, the suggestions panel collapses into a floating action button. Tap the sparkles icon to open a bottom sheet with the full suggestion library.
Transportation & Transit Highlights
Auto-fetched nearby transit stops, airports, and highways from Google Places API.

- 1Rich Text Editor
- 2Transportation Panel
- 3Suggestion Categories
Transportation sections
Transit
Nearby bus stops, light rail stations, and subway stations. Auto-fetched from Google Places within a 1-mile radius.
Airports
Commercial and regional airports within a reasonable distance. Shows name and distance in miles.
Highways
Major highways and interstate access points. Add manually or auto-detected from transit data.
Editing transportation items
- --Remove items by clicking the X button next to any transit stop, airport, or highway.
- --Add custom items with the "+ Add" button at the bottom of each section. Enter a name and distance in miles.
- --Refresh data with the refresh button to re-fetch from Google Places (useful if you changed the property address).
- --Distances display in miles or feet depending on proximity (under 0.1 mi shows feet).
Market Overview & Demographics
City narrative, demographic data, and market context for your property's location.

- 1Page Title
- 2Rich Text Narrative
- 3City Photo
- 4Key Facts Panel
Auto-populated content
- City narrative -- when you first visit this page, CREBuilder auto-generates a market overview narrative for your city. The text covers population, economic drivers, major employers, and growth trends.
- Demographics -- population, median household income, employment statistics, and growth projections are fetched from Esri ArcGIS demographics API using the property coordinates.
- City photos -- search for and select city/skyline photos that appear on the Market Overview page of your document.
Editing the narrative
The auto-generated text is fully editable. Use the rich text editor to refine the narrative, add local market knowledge, or incorporate specific data points. The character limit (3,000 characters) ensures the text fits within the template page area without overflow.
Demographics data comes from Esri and is cached to minimize API calls. If the data looks stale or incorrect, verify that the property coordinates are accurate on the Property Details page.
Key Facts
Draggable label/value pairs that appear on the Market Overview page. Auto-fetched from Wikidata.
How Key Facts work
| Label | Value | ||
|---|---|---|---|
| Population | 1,608,139 | x | |
| Median Household Income | $64,427 | x | |
| Unemployment Rate | 3.2% | x | |
| Major Employers | Banner Health, Intel, Raytheon | x |
- --Auto-fetched -- key facts are pulled from Wikidata for your property's city (population, median income, area, elevation, etc.).
- --Fully editable -- click any label or value to edit it inline. Both columns are free-form text.
- --Drag to reorder -- grab the grip handle to change the display order. The order matches the printed document.
- --Add custom facts -- click "Add Key Fact" to add your own label/value pairs (e.g., "Average Rent Growth" or "Vacancy Rate").
Key facts are separate from the property data table. Property Data appears on the Property Summary page; Key Facts appear on the Market Overview page. Use Property Data for building-specific metrics and Key Facts for market-level statistics.