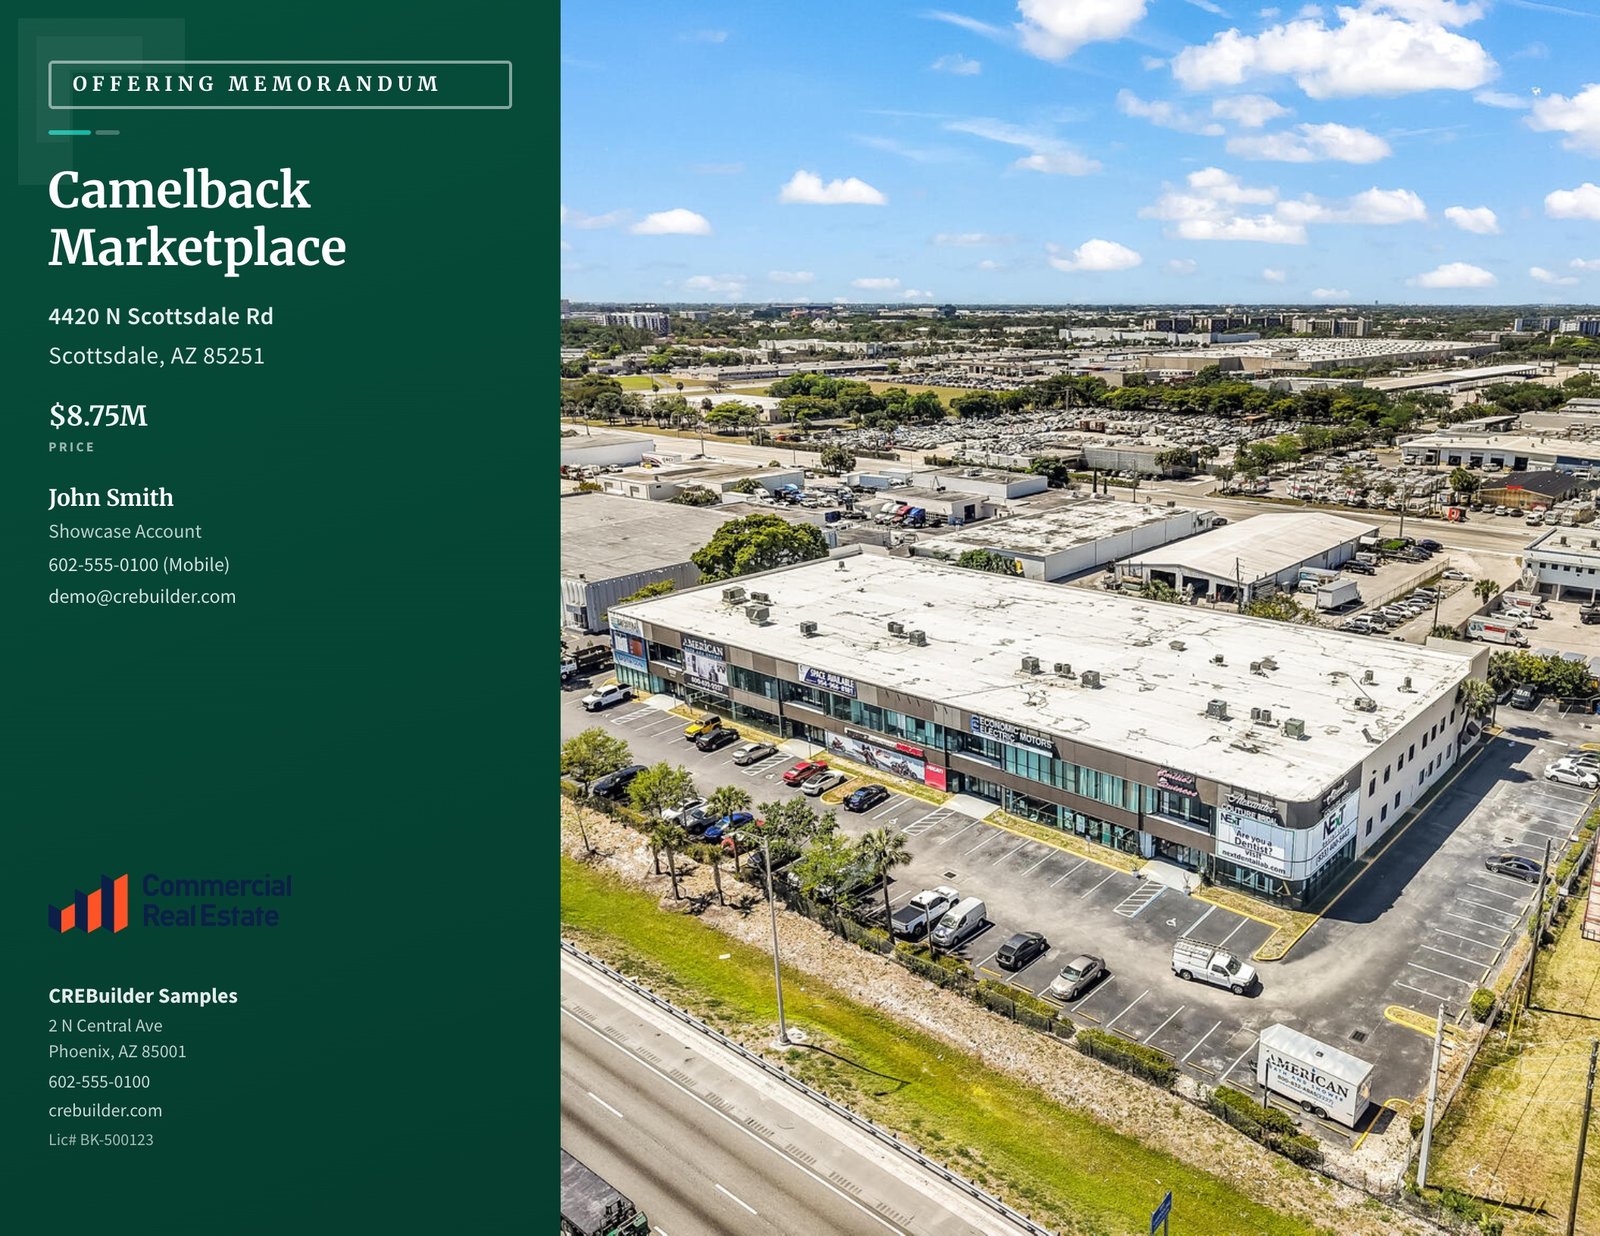
The rent roll is the page buyers trust more than any other in your OM, because it's the one they can check. The cover sells the deal. The executive summary frames it. The rent roll is where a buyer finds out whether the story holds up: who pays, how much, for how much longer, and how much of the building is producing income today.
Present it well and the buyer starts underwriting with confidence. Present it badly, or "attached separately," and you've handed them their first reason to discount your price. Here's how to build a rent roll page that does its job.
What is a rent roll in commercial real estate?
A rent roll is a tenant-by-tenant schedule of a property's leases: who occupies each suite, how big it is, what they pay, how the lease is structured and when it ends. For multifamily, it's the unit schedule, either every unit or a unit mix summarizing unit types.
In an offering memorandum, the rent roll is the bridge between the property and the valuation. Gross potential rent comes from it, NOI is built on it, and the cap rate on your cover only means something if the rent roll supports it.
The columns buyers expect
For retail, office and industrial, a buyer wants to see these on every row:
| Column | Why buyers want it |
|---|---|
| Suite | Ties the schedule to the site plan |
| Tenant | Credit and use, at a glance |
| SF | Share of the building each tenant controls |
| Rent/SF | Compares in-place rent to market |
| Monthly and annual rent | The income, in the unit buyers model in |
| Reimbursements | What the tenant pays back in taxes, insurance and CAM |
| Lease type | NNN, modified gross or full service changes the math |
| Start and end dates | Rollover risk and remaining term |
Options, escalations and security deposits are worth including when you have them, either as columns or in the notes beneath the table.
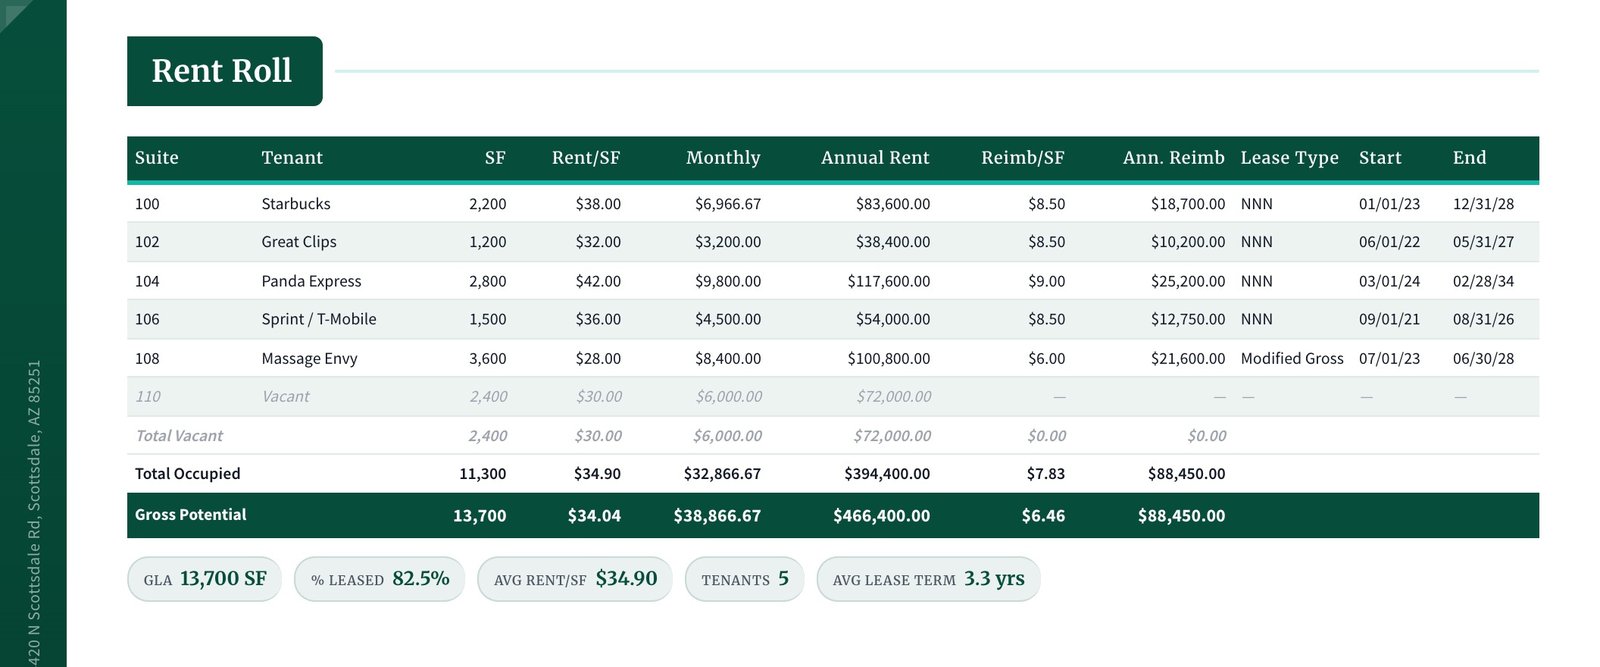
Show the totals buyers would otherwise calculate
A rent roll without totals forces the buyer to open a spreadsheet before they've decided whether they care. Give them the summary rows:
- Total occupied: SF and annual rent from tenants in place
- Total vacant: SF and the rent you're assuming it could achieve
- Gross potential: what the building produces fully leased
Then add the handful of figures a buyer actually quotes back to you: GLA, percent leased, average rent per SF, tenant count and average remaining lease term.
Here's why the totals matter. In the example above, 11,300 of 13,700 SF is leased, so the building is 82.5% occupied physically. The occupied suites carry $394,400 of scheduled base rent against a $466,400 gross potential, about 84.6% economic occupancy. A buyer who sees both numbers understands the vacancy story in one glance. A buyer who has to compute them may decide not to.
That economic figure is base-rent economic occupancy: contract rent from occupied suites over gross potential rent. Free rent, concessions and collection loss show up on the operating statement, and the bridge to NOI below shows how the two connect.
Keep the vacancy on the page
It's tempting to drop the empty suite from the schedule. Don't. Show it with its SF and the market rent you're assuming, clearly marked as vacant.
Experienced buyers will find the vacancy in the site plan or on the tour. If they find it before you mention it, you've lost credibility you need for the rest of the deal. Shown up front, the same vacant suite becomes upside: lease-up potential the buyer can underwrite.
Date it and label it
Every rent roll should carry an "as of" date. Leases expire, tenants renew, rents step up. A buyer reading in March needs to know whether the schedule reflects January or last August.
Keep in-place rent and pro forma separate, too. If your valuation assumes the vacant suite leases at $30.00/SF, say so in the pro forma, not by blending it into the in-place income.
Unit-by-unit or unit mix?
For retail, office and industrial, list every suite. For multifamily, it depends on size:
- Unit-by-unit works for smaller properties where a buyer wants to see each unit's rent.
- Unit mix works for larger properties: one row per unit type with count, average SF, in-place rent and market rent.
Either way, the scheduled rent should reconcile to rental income on your operating statement for the same period.
Bridge the rent roll to NOI
Buyers will tie your rent roll to the operating statement, so do it for them. Scheduled base rent on the rent roll should match base rental income for the same period. From there, the bridge to NOI is short:
| Annual, same period | Amount |
|---|---|
| Gross potential base rent | $466,400 |
| Less vacant suite (Suite 110) | ($72,000) |
| Scheduled base rent, occupied suites | $394,400 |
| Plus expense reimbursements | $88,450 |
| Plus other income | $4,800 |
| Effective gross income | $487,650 |
| Less operating expenses | ($121,900) |
| Net operating income | $365,750 |
The first four lines come straight from the rent roll above. Other income and operating expenses come from the operating statement. If rental income on the T-12 differs from the rent roll, explain it in one line: a lease signed mid-year, a free-rent month, a tenant who moved out.
What goes in the OM, and what goes in the Deal Room
The OM rent roll is a presentation: clean, summarized and readable. The source files are a different thing. Full lease abstracts, the seller's rent roll export, the T-12 and estoppels belong behind a signed NDA, where you control who sees them.
In a CREBuilder Deal Room, buyers can be gated behind an email, an e-signed NDA, or an NDA you approve before the files unlock. PDF downloads carry the buyer's identity, so a forwarded rent-roll PDF still names the buyer who downloaded it. You see which buyer opened the rent-roll file and how often. The buyer who's downloaded it three times this week is your first call.
Common rent roll mistakes
- Rent and NOI with no bridge between them. $394,400 of scheduled rent and a $365,750 NOI aren't a contradiction, but a buyer shouldn't have to work out how one became the other. Show the bridge.
- Missing lease dates. Remaining term drives value. A row without an end date is a question you've left the buyer to ask.
- Units without labels. "$32" could be monthly, annual, gross or NNN. Label the column.
- A screenshot of a spreadsheet. It reads as unfinished, and it never matches the rest of the book.
Building the rent roll in CREBuilder
In CREBuilder, the rent roll is built into the OM, not pasted into it. Choose unit-by-unit or unit mix, enter each tenant's suite, SF, rent and reimbursements, and watch the formatted page build in the document preview beside the editor. The same financials section covers the pro forma, multi-year cash flow with escalations, income and expenses, and sales and rental comps.
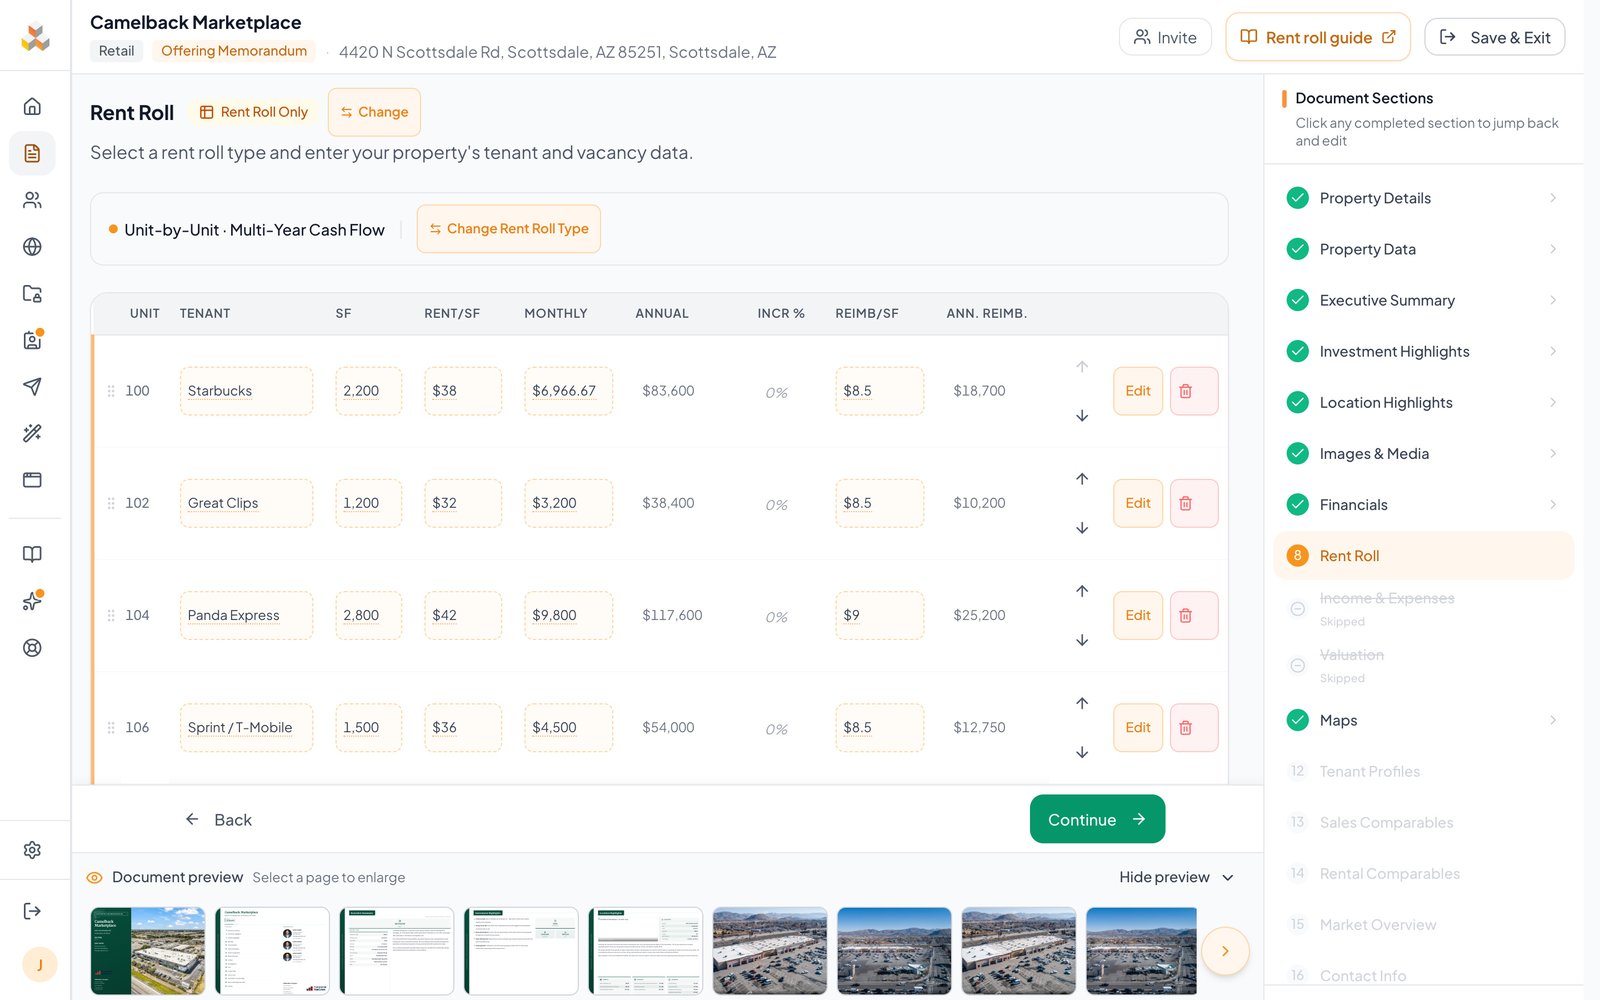
Enter the price and NOI and the cap rate calculates itself. Price, NOI and cap rate come from one source, so the calculated price, NOI and cap-rate fields stay aligned across the cover, the calculated executive-summary metric cards, the financial summary and the valuation pages.
Frequently asked questions
What should a commercial rent roll include?
Suite, tenant, SF, rent per SF, monthly and annual rent, reimbursements, lease type, and lease start and end dates, plus totals for occupied, vacant and gross potential rent. Add options and escalations when you have them.
Should the rent roll go in the OM or be sent separately?
Put a formatted rent roll in the OM so buyers can underwrite from the book. Keep the source files, leases and T-12 in a Deal Room behind an NDA.
What's the difference between physical and economic occupancy?
Physical occupancy is leased SF divided by total SF. Economic occupancy is in-place rent divided by gross potential rent. When vacant space would rent above the building's average, economic occupancy runs lower than physical occupancy, and vice versa.
Make the page buyers check your best page
The rent roll is where a buyer decides whether to trust everything else you've written. Make it complete, readable and consistent with the rest of the book. Build your first OM free.
Sample property shown.