Building an Offering Memorandum
A complete walkthrough of every wizard step
This guide walks you through every section of the CREBuilder wizard for a single-property OM, from the creation flow to PDF export. Each step shows a real screenshot of the actual interface with numbered callouts explaining the controls.
What is an Offering Memorandum?
An Offering Memorandum (OM) is the marketing document used to sell commercial real estate investment properties. It gives buyers everything they need to evaluate the deal: property details, financial analysis, tenant information, market data, and professional photography — think of it as the property's resume.
CREBuilder's wizard walks through every section. You don't have to complete sections in order; jump around freely from the right sidebar. Changes save automatically as you work.
Before you start — get these from the deal
The wizard saves as you go, but having these items in front of you up front makes the whole flow about 30 minutes instead of two hours of back-and-forth.
- • Property address, name, and asking price
- • Photos (cover + interior + aerial)
- • Rent roll (tenants, SF, rent, lease dates)
- • T-12 (trailing twelve months) operating statement
- • Property tax bill + insurance + CAM expenses
- • Survey or site plan if available
- • Cap rate target or NOI
- • Sales + rental comps (3-5 each)
- • Co-listing agent / team info
- • Brokerage's standard confidentiality language
Not sure what NOI, NNN, Cap Rate, Pro Forma, or WALT mean? Open the CRE Glossary — plain-English definitions of every term used in this guide, organized by category.
1. Pick the Marketing Package
Creation starts by picking what kind of document you're making. For this walkthrough we're building an Offering Memorandum — the most comprehensive option, ideal for investment sales with full financials.
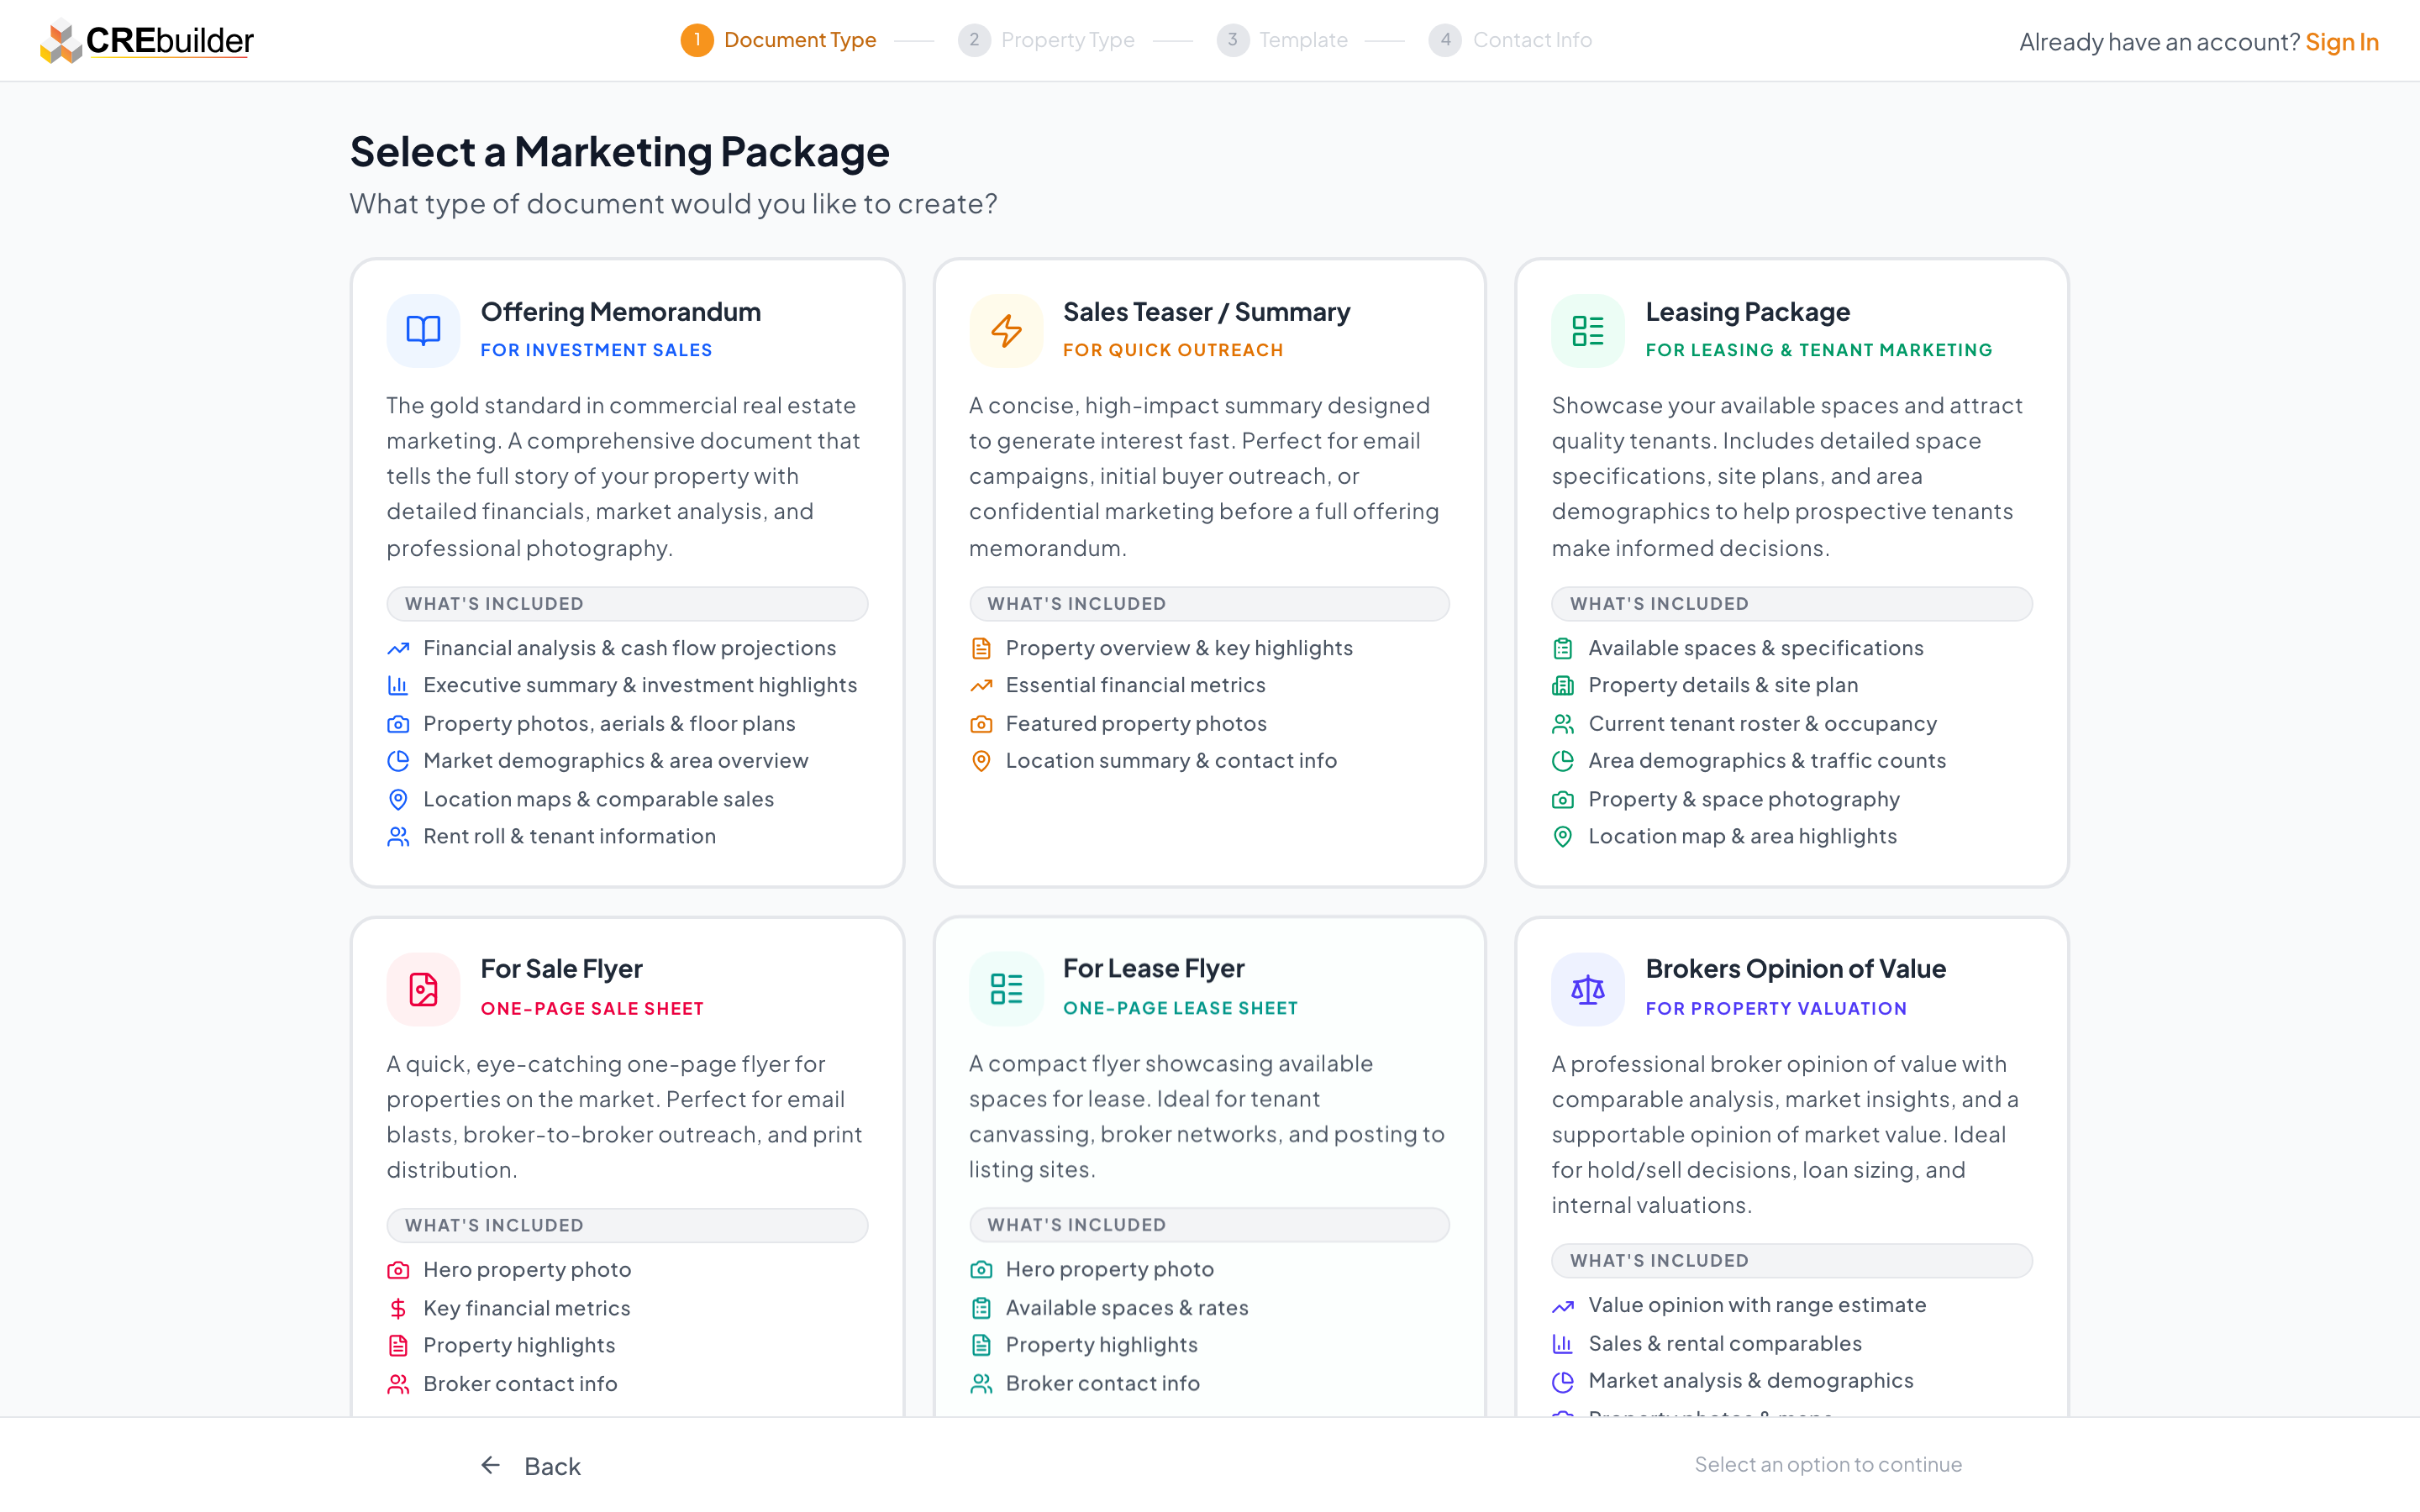
- 1Offering Memorandum — The gold standard. Financials, rent roll, comparables, investment analysis, tenant profiles, market data, photography.
- 2Sales Teaser / Summary — Concise deal summary for email blasts and initial buyer outreach before sharing the full OM.
- 3Leasing Package — Lease-up marketing — available space, lease terms, property features for attracting tenants.
- 4For Sale / For Lease Flyer — One-page sheets for email blasts and broker networks. Single-property only.
- 5Broker's Opinion of Value — Formal property valuation with comparables and market analysis. Common for bank underwriting and estate valuations. Single-property only.
OM, Sales Teaser, and Leasing Package all support single OR multi-property mode (you pick on the next sub-step). Flyers and BOVs are single-property only.
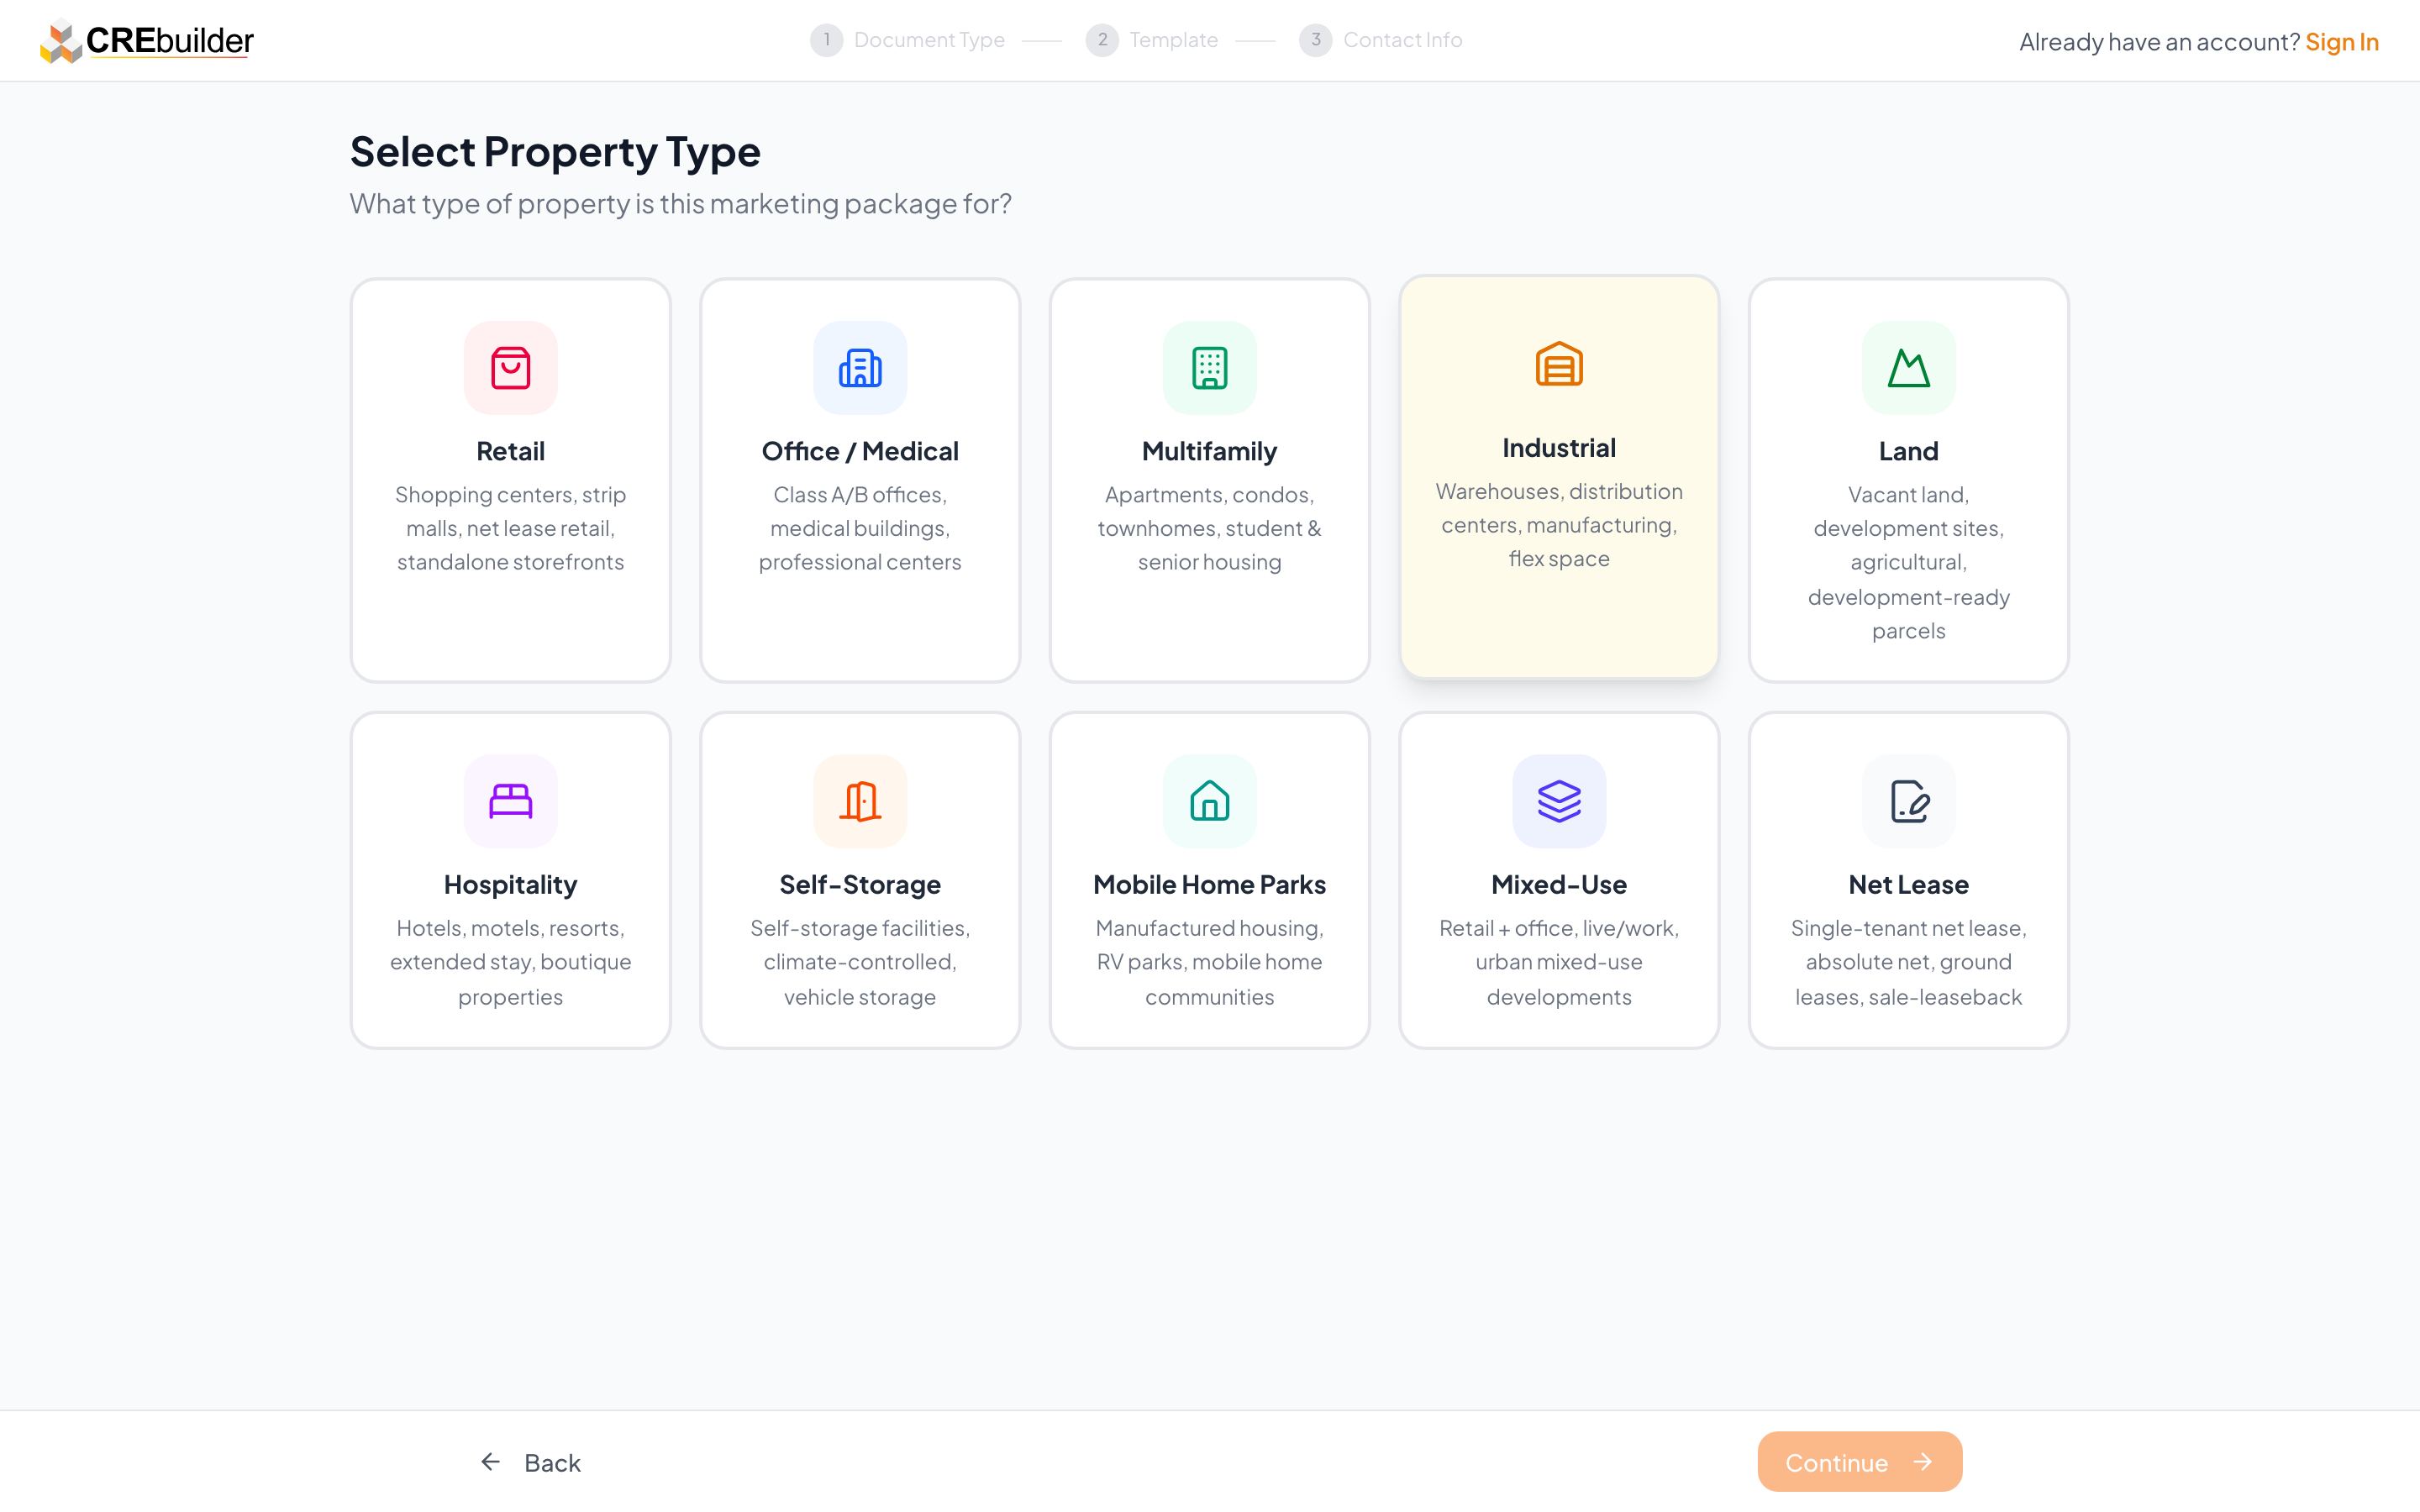
2. Pick the Property Type
After picking the package, choose the property type. Your selection tailors the wizard steps, financial models, rent-roll columns, and template layouts. Multi-property docs skip this step — each building gets its own property type later on the Buildings step.

- 1Ten user-facing types: Retail, Office/Medical, Multifamily, Industrial, Land, Hospitality, Self-Storage, Mobile Home Parks, Mixed-Use, and Net Lease. Each one adapts the wizard's content sections, financial logic, and which rent-roll/expense fields appear.
Multi-tenant retail centers go under Retail. Single-tenant absolute-net deals (Walgreens, Dollar General, single-tenant bank branches) use Net Lease. Medical offices fall under Office/Medical.
3. Pick a Template & Brand Color
CREBuilder ships with six theme templates — Classic, Modern, Professional, Executive, Premium, and Heritage. Each theme uses a distinct typography and layout style. You can switch templates later from the Review step without losing any content.
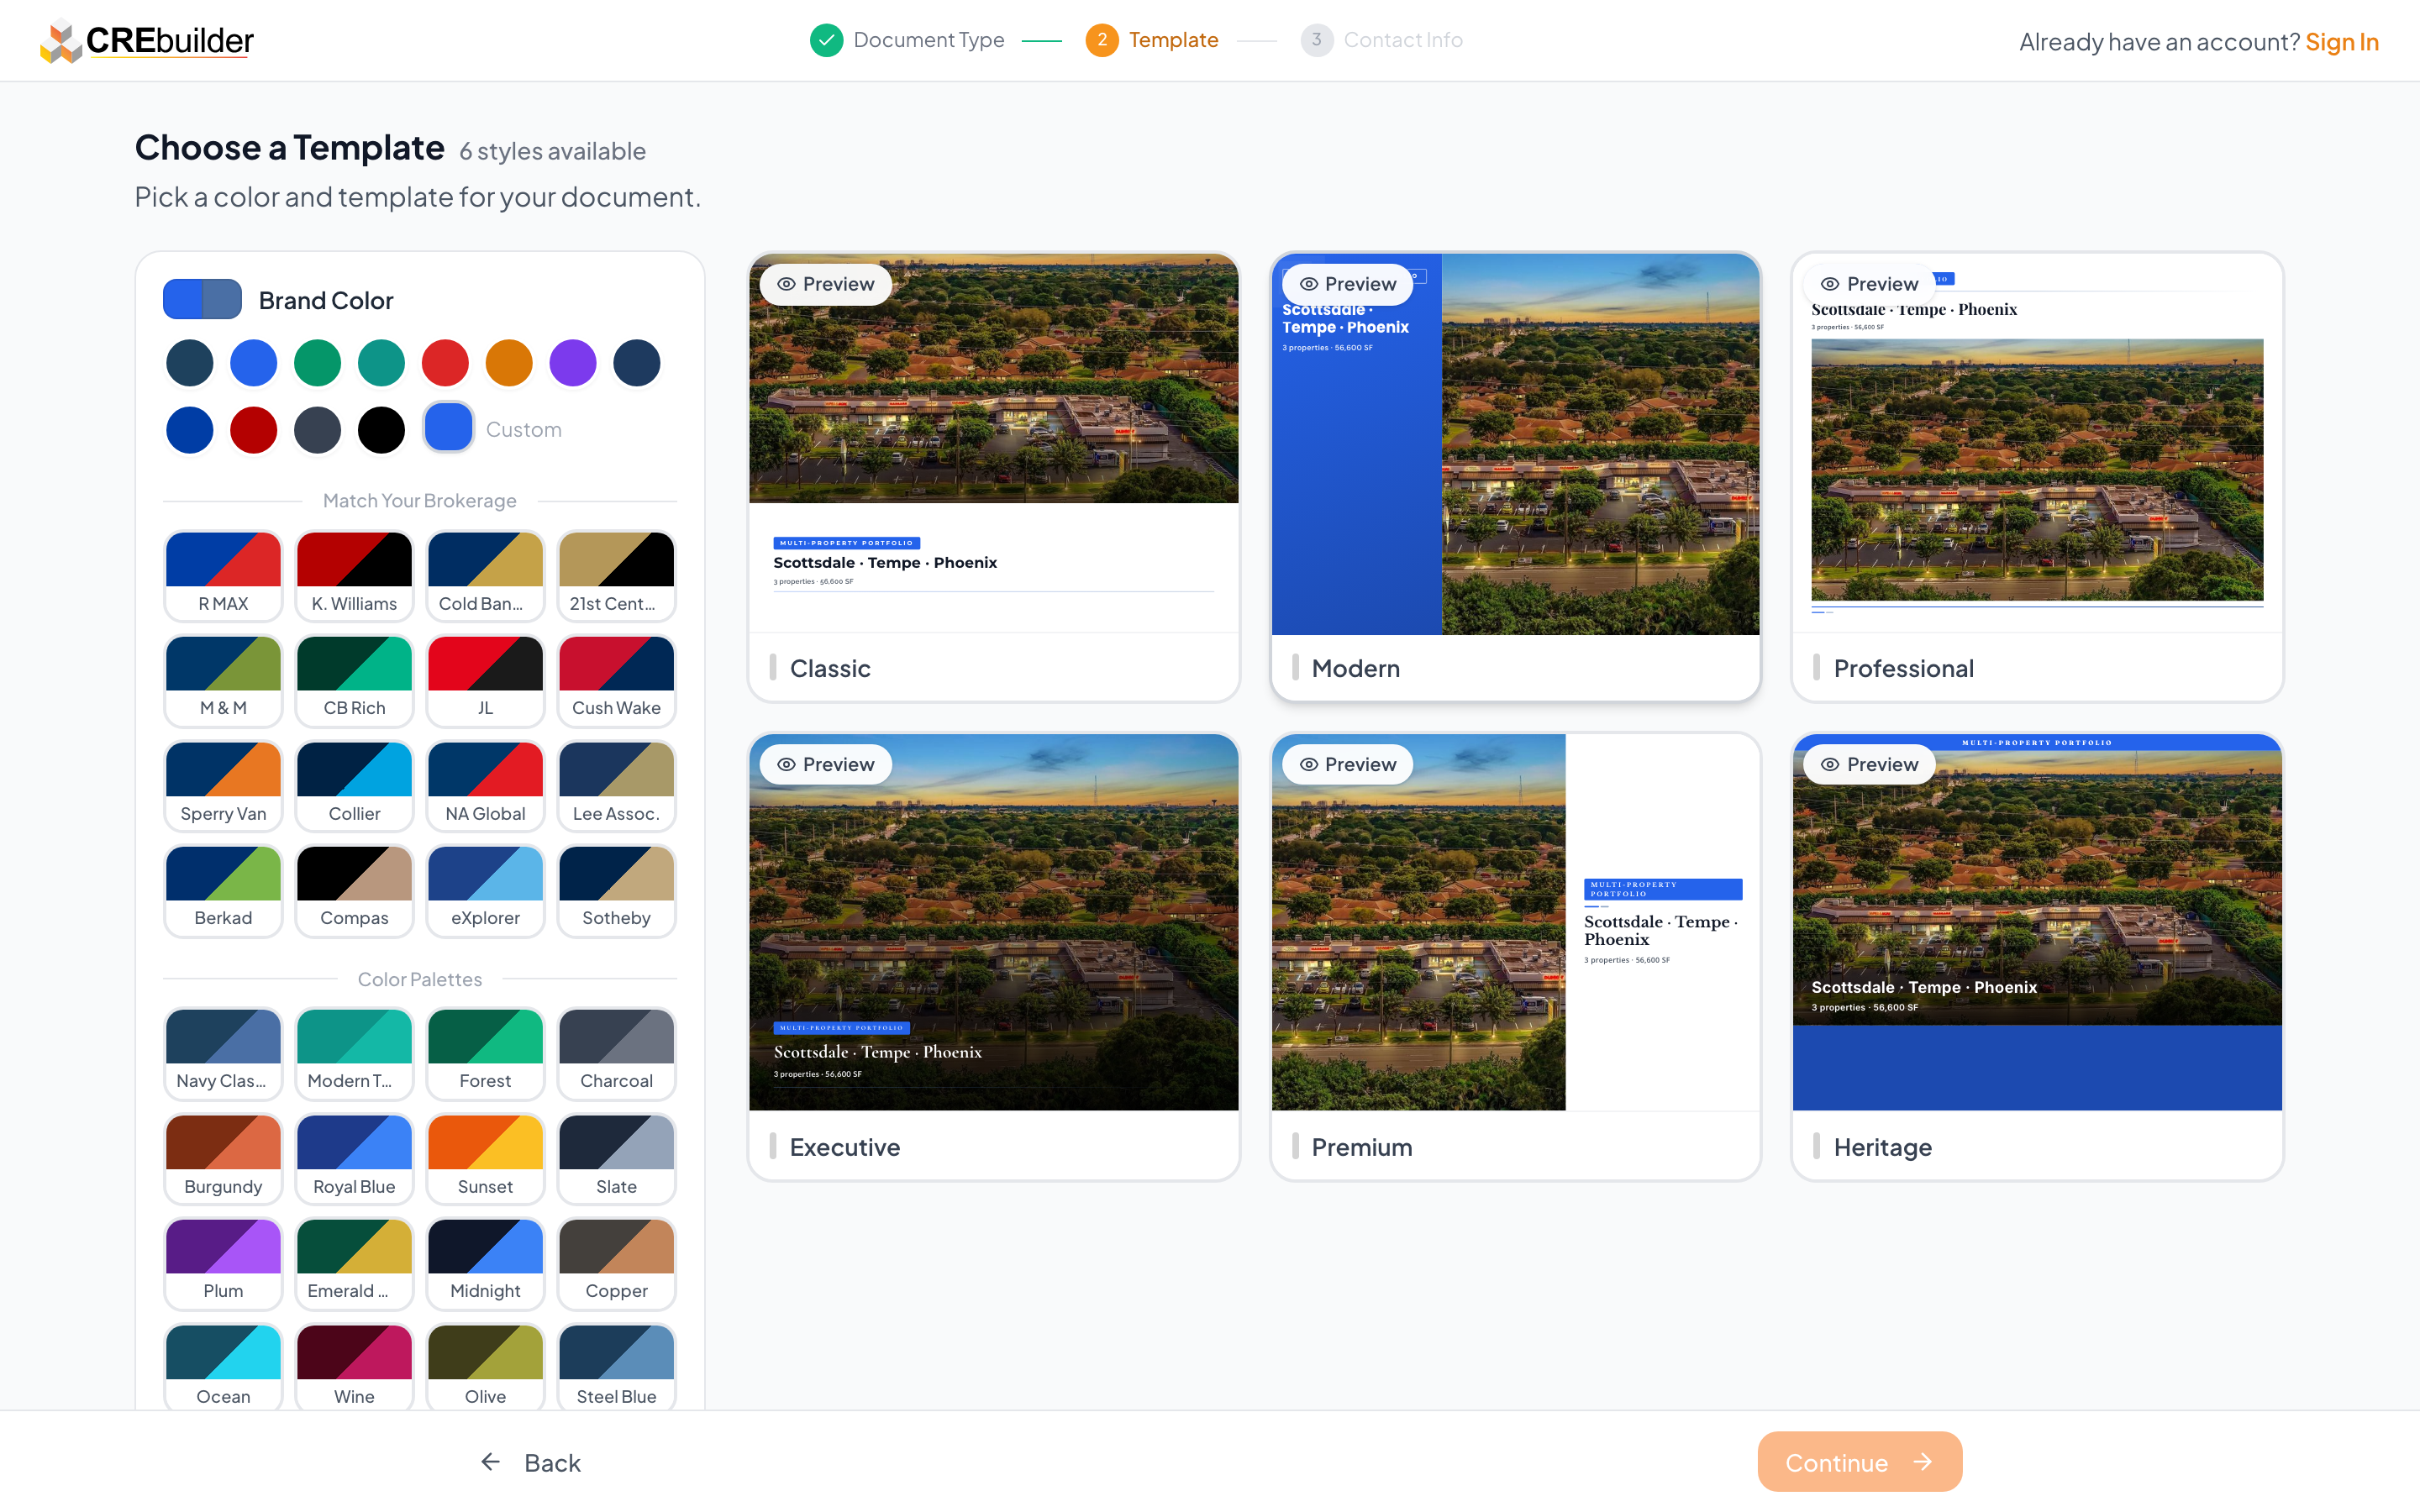
- 1Brand Color — 12 quick-pick swatches plus a custom color wheel for exact brand match. Secondary color is auto-derived. Annual subscribers can also request a fully custom branded template at /custom-templates.
- 2Pick Your Brokerage — 16 brokerage-branded palettes pre-built for CBRE, JLL, Cushman & Wakefield, Marcus & Millichap, and others.
- 3Color Palettes — 16 curated multi-color schemes for users who prefer a designer-picked look over a single brand color.
- 4Six theme cover previews — Classic (traditional layout), Modern (bold geometric), Professional (refined corporate), Executive (editorial/luxury), Premium (full-bleed hero), and Heritage (serif headline). Previews update in real time as you change colors.
Themes are layout-only — your brand color flows through every theme. Pick a template you like the structure of, then refine the color to match your firm.
4. Enter Contact Info (first-time only)
On your very first document, the wizard asks for your contact info. The details save to your account profile and auto-fill on every future document — so you'll only see this step once.
- 1Already signed in? This step is skipped entirely. The wizard pulls from your profile and drops you straight into the editor.
5. Property Details
This is where you enter the basic property information that flows through the entire document. The property name appears on the cover page, in the header of every interior page, and as the doc title in your dashboard.
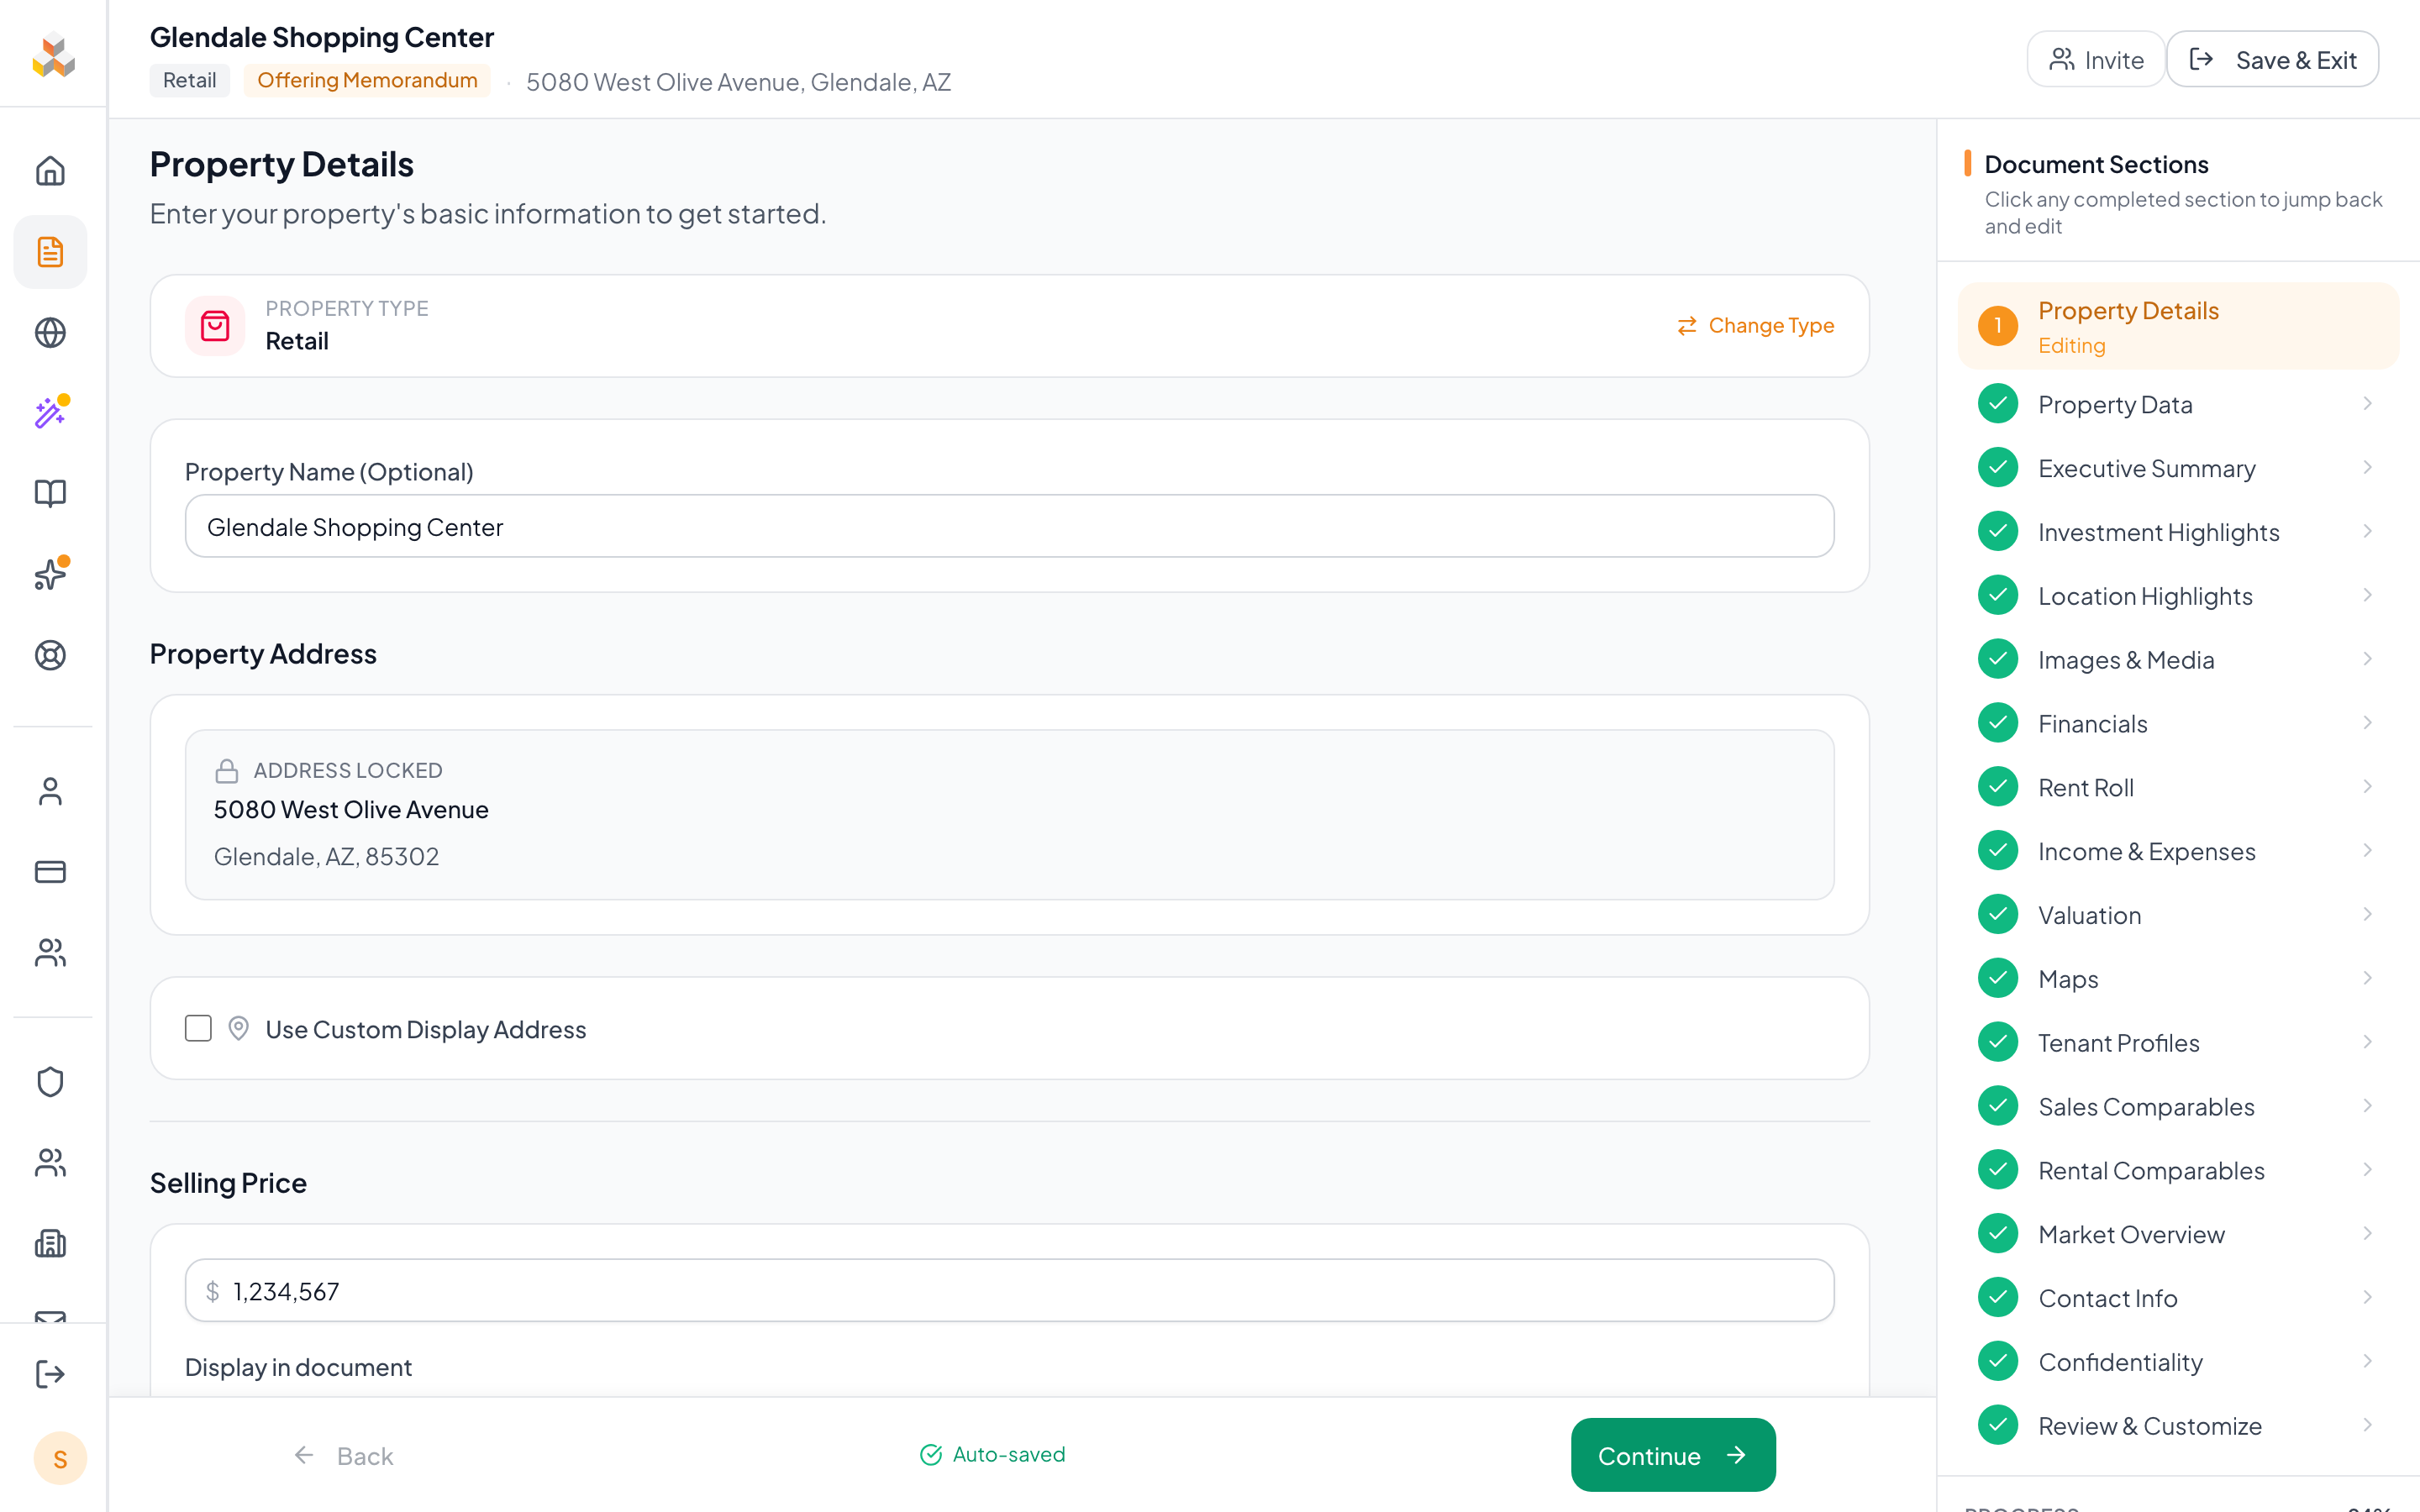
- 1Property name — The marketing name buyers see first — e.g., "Sunset Plaza Shopping Center" or "1234 Main St Office Building". Saves every 800ms while you type plus on blur, so closing the tab mid-edit is safe.
- 2Address autocomplete — Start typing the street address and Google autocomplete suggests matches. Picking a suggestion fills in the city, state, ZIP, and coordinates automatically — and unlocks the Property Data auto-fill on the next step.
- 3Selling price — Asking price for the document. Pick whether to show the price, hide it, or display "Negotiable" on the cover. Price-per-SF auto-calculates once you enter building size on the Property Data step. Selling Price flushes to the server on blur so closing the tab inside the debounce window doesn't lose the edit.
- 4Document Sections sidebar — Every wizard section is listed on the right. Green check = completed, orange dot = currently editing, gray = not visited. Click any completed section to jump back and edit.
Address autocomplete works best when you start with the street number. If the property is new construction or not yet in Google Maps, you can type the full address manually.
6. Property Data
Enter the building specifications. These data points feed the Property Summary page and the Key Facts boxes on the cover. The visible fields adapt to your property type — Multifamily shows units, Industrial shows clear height, Hospitality shows room count, and so on.
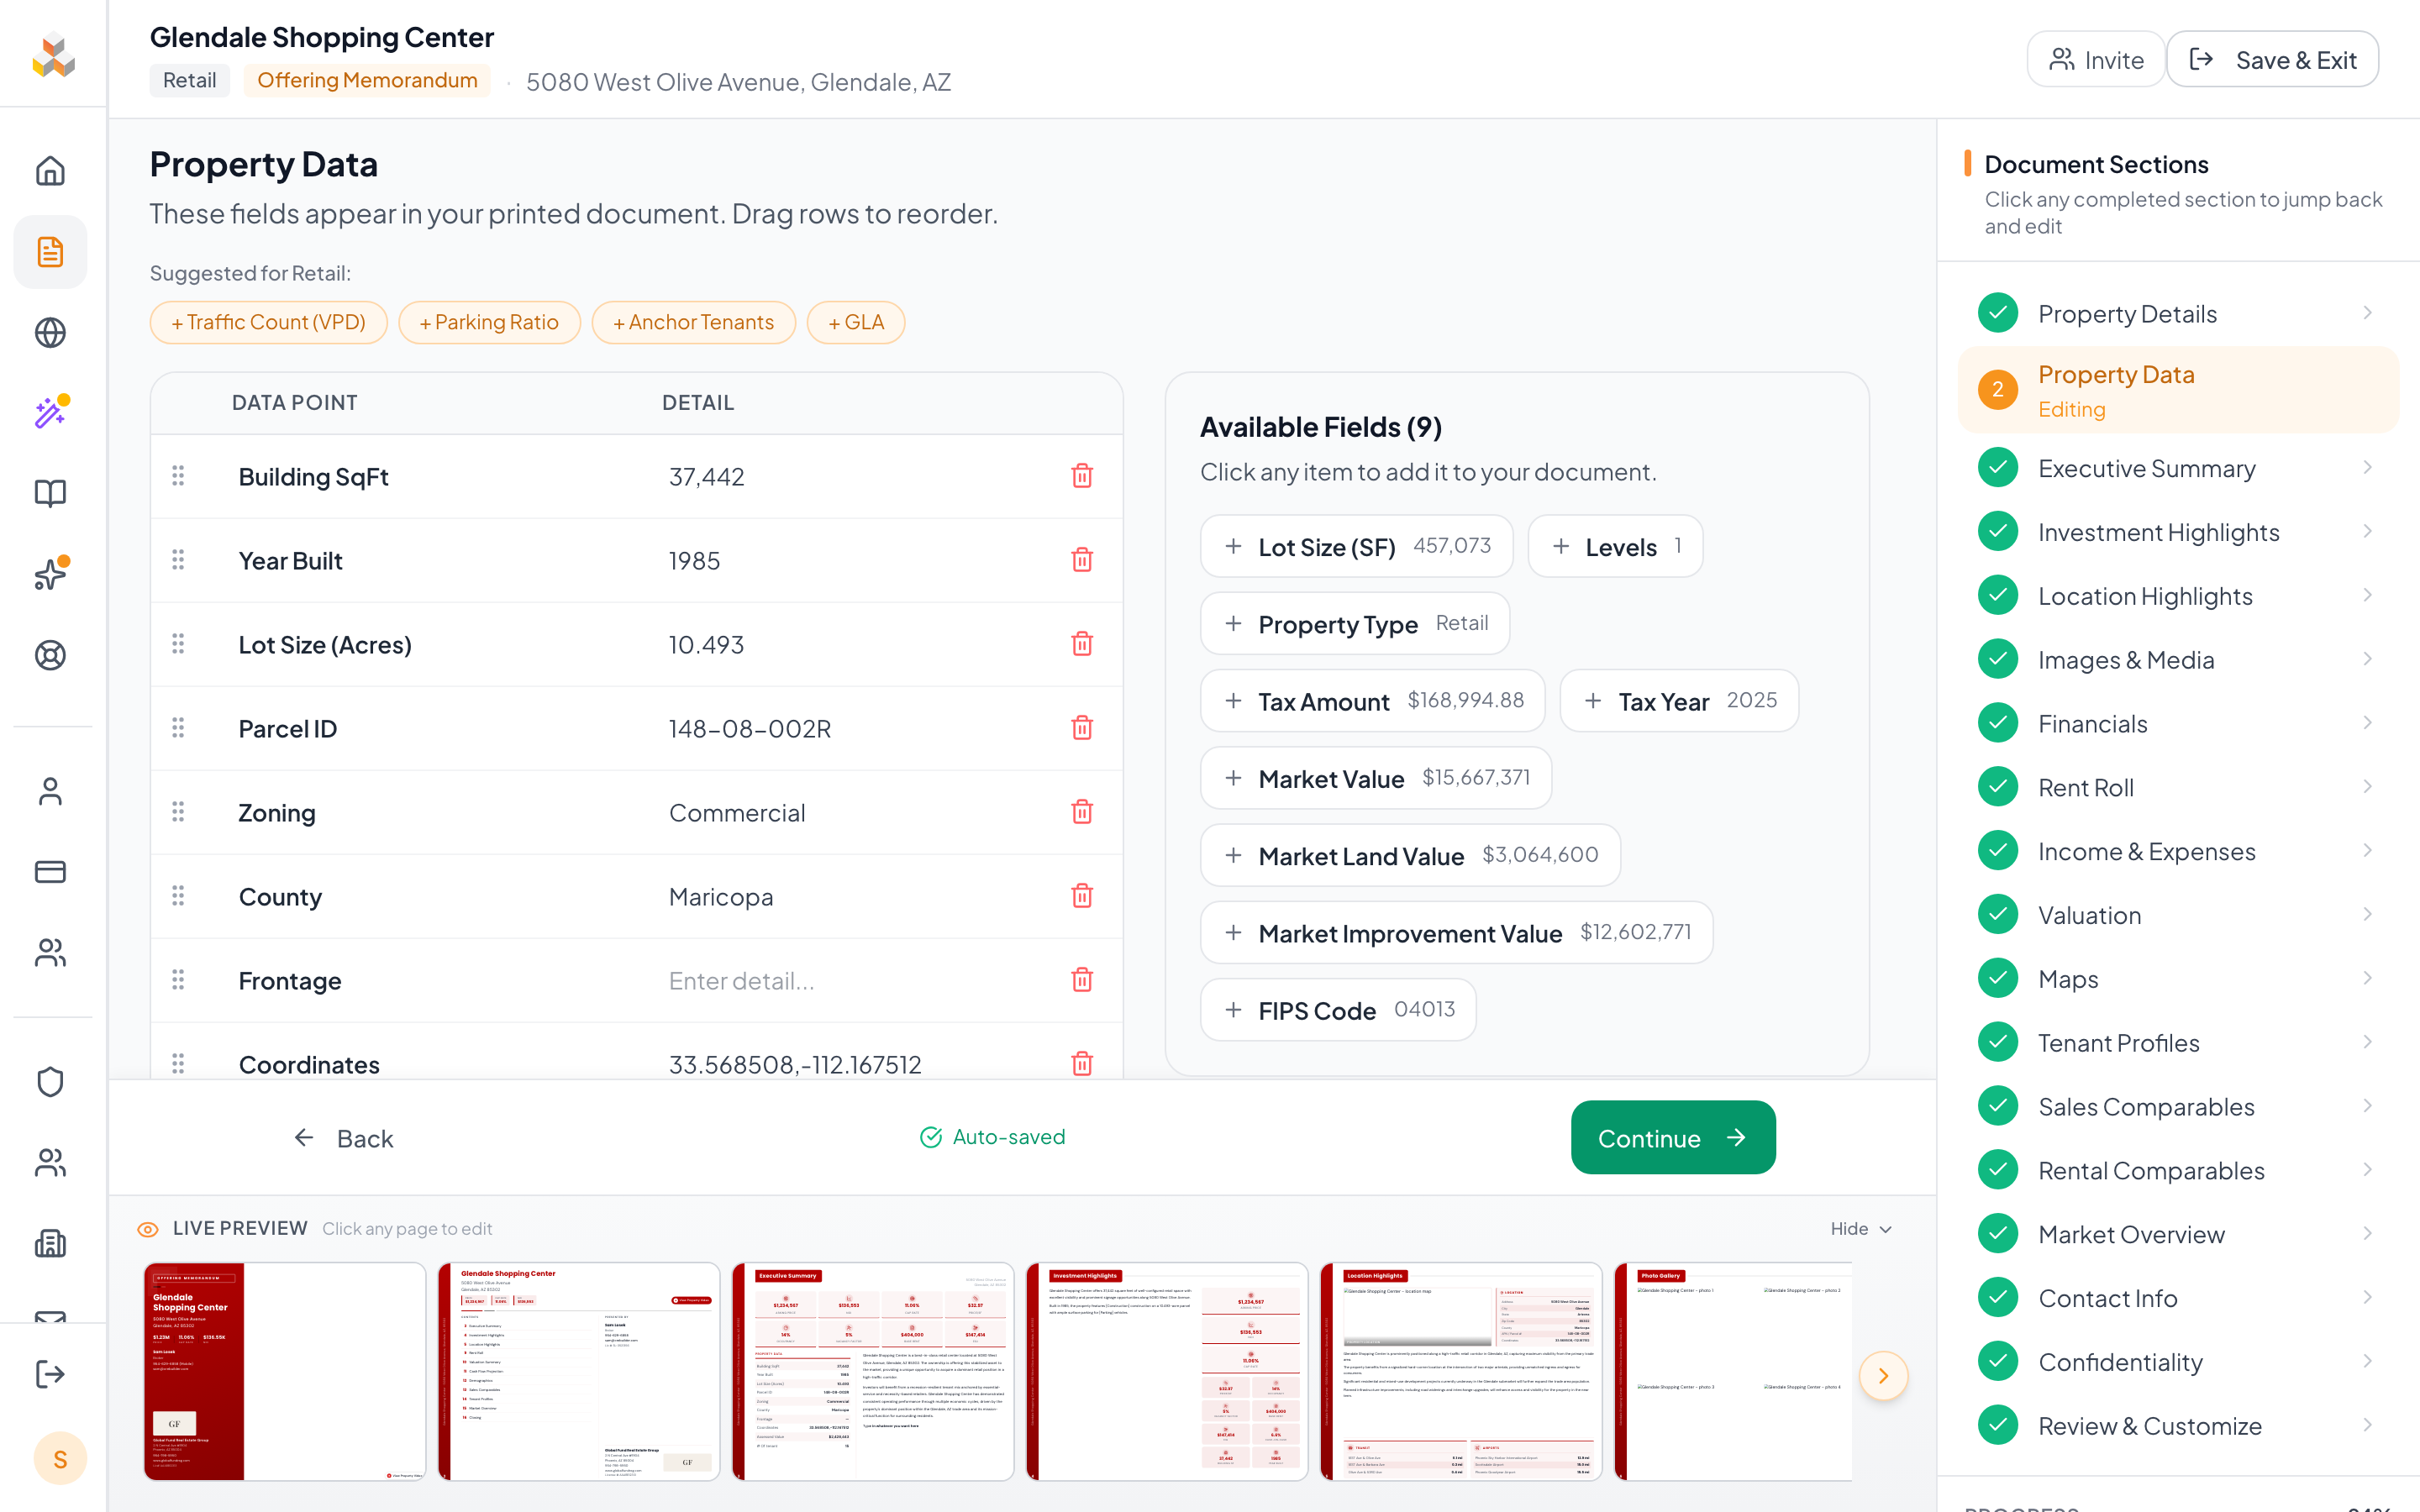
- 1Building details — Standard fields are Year Built, Lot Size (acres + SF), Building SF, Number of Units/Suites (total physical units including vacant), Stories, and Parking. Not all are required — fill in what you have.
- 2Lookup Property Data — Pulls Year Built, Lot Size, Building SF, Zoning, Parcel ID, and other facts from public records (ATTOM). Coverage is roughly 70-75% of properties — newly built, recently subdivided, or non-disclosure-state properties (TX, UT, ID) may return partial or no data. Fill the gaps manually.
- 3Custom fields — Add property-specific labels like Traffic Count, Anchor Tenants, Clear Height, LEED Certification, or any label/value pair. Drag rows to reorder them; click the trash to remove them.
For multi-property docs, Property Data lives PER building — switch between buildings using the Building Selector chip at the top of the step. Also note: Property Tax pulled from ATTOM reflects the LAST assessed value; after a sale most jurisdictions reassess. Underwrite to forward-year tax based on the new assessment.
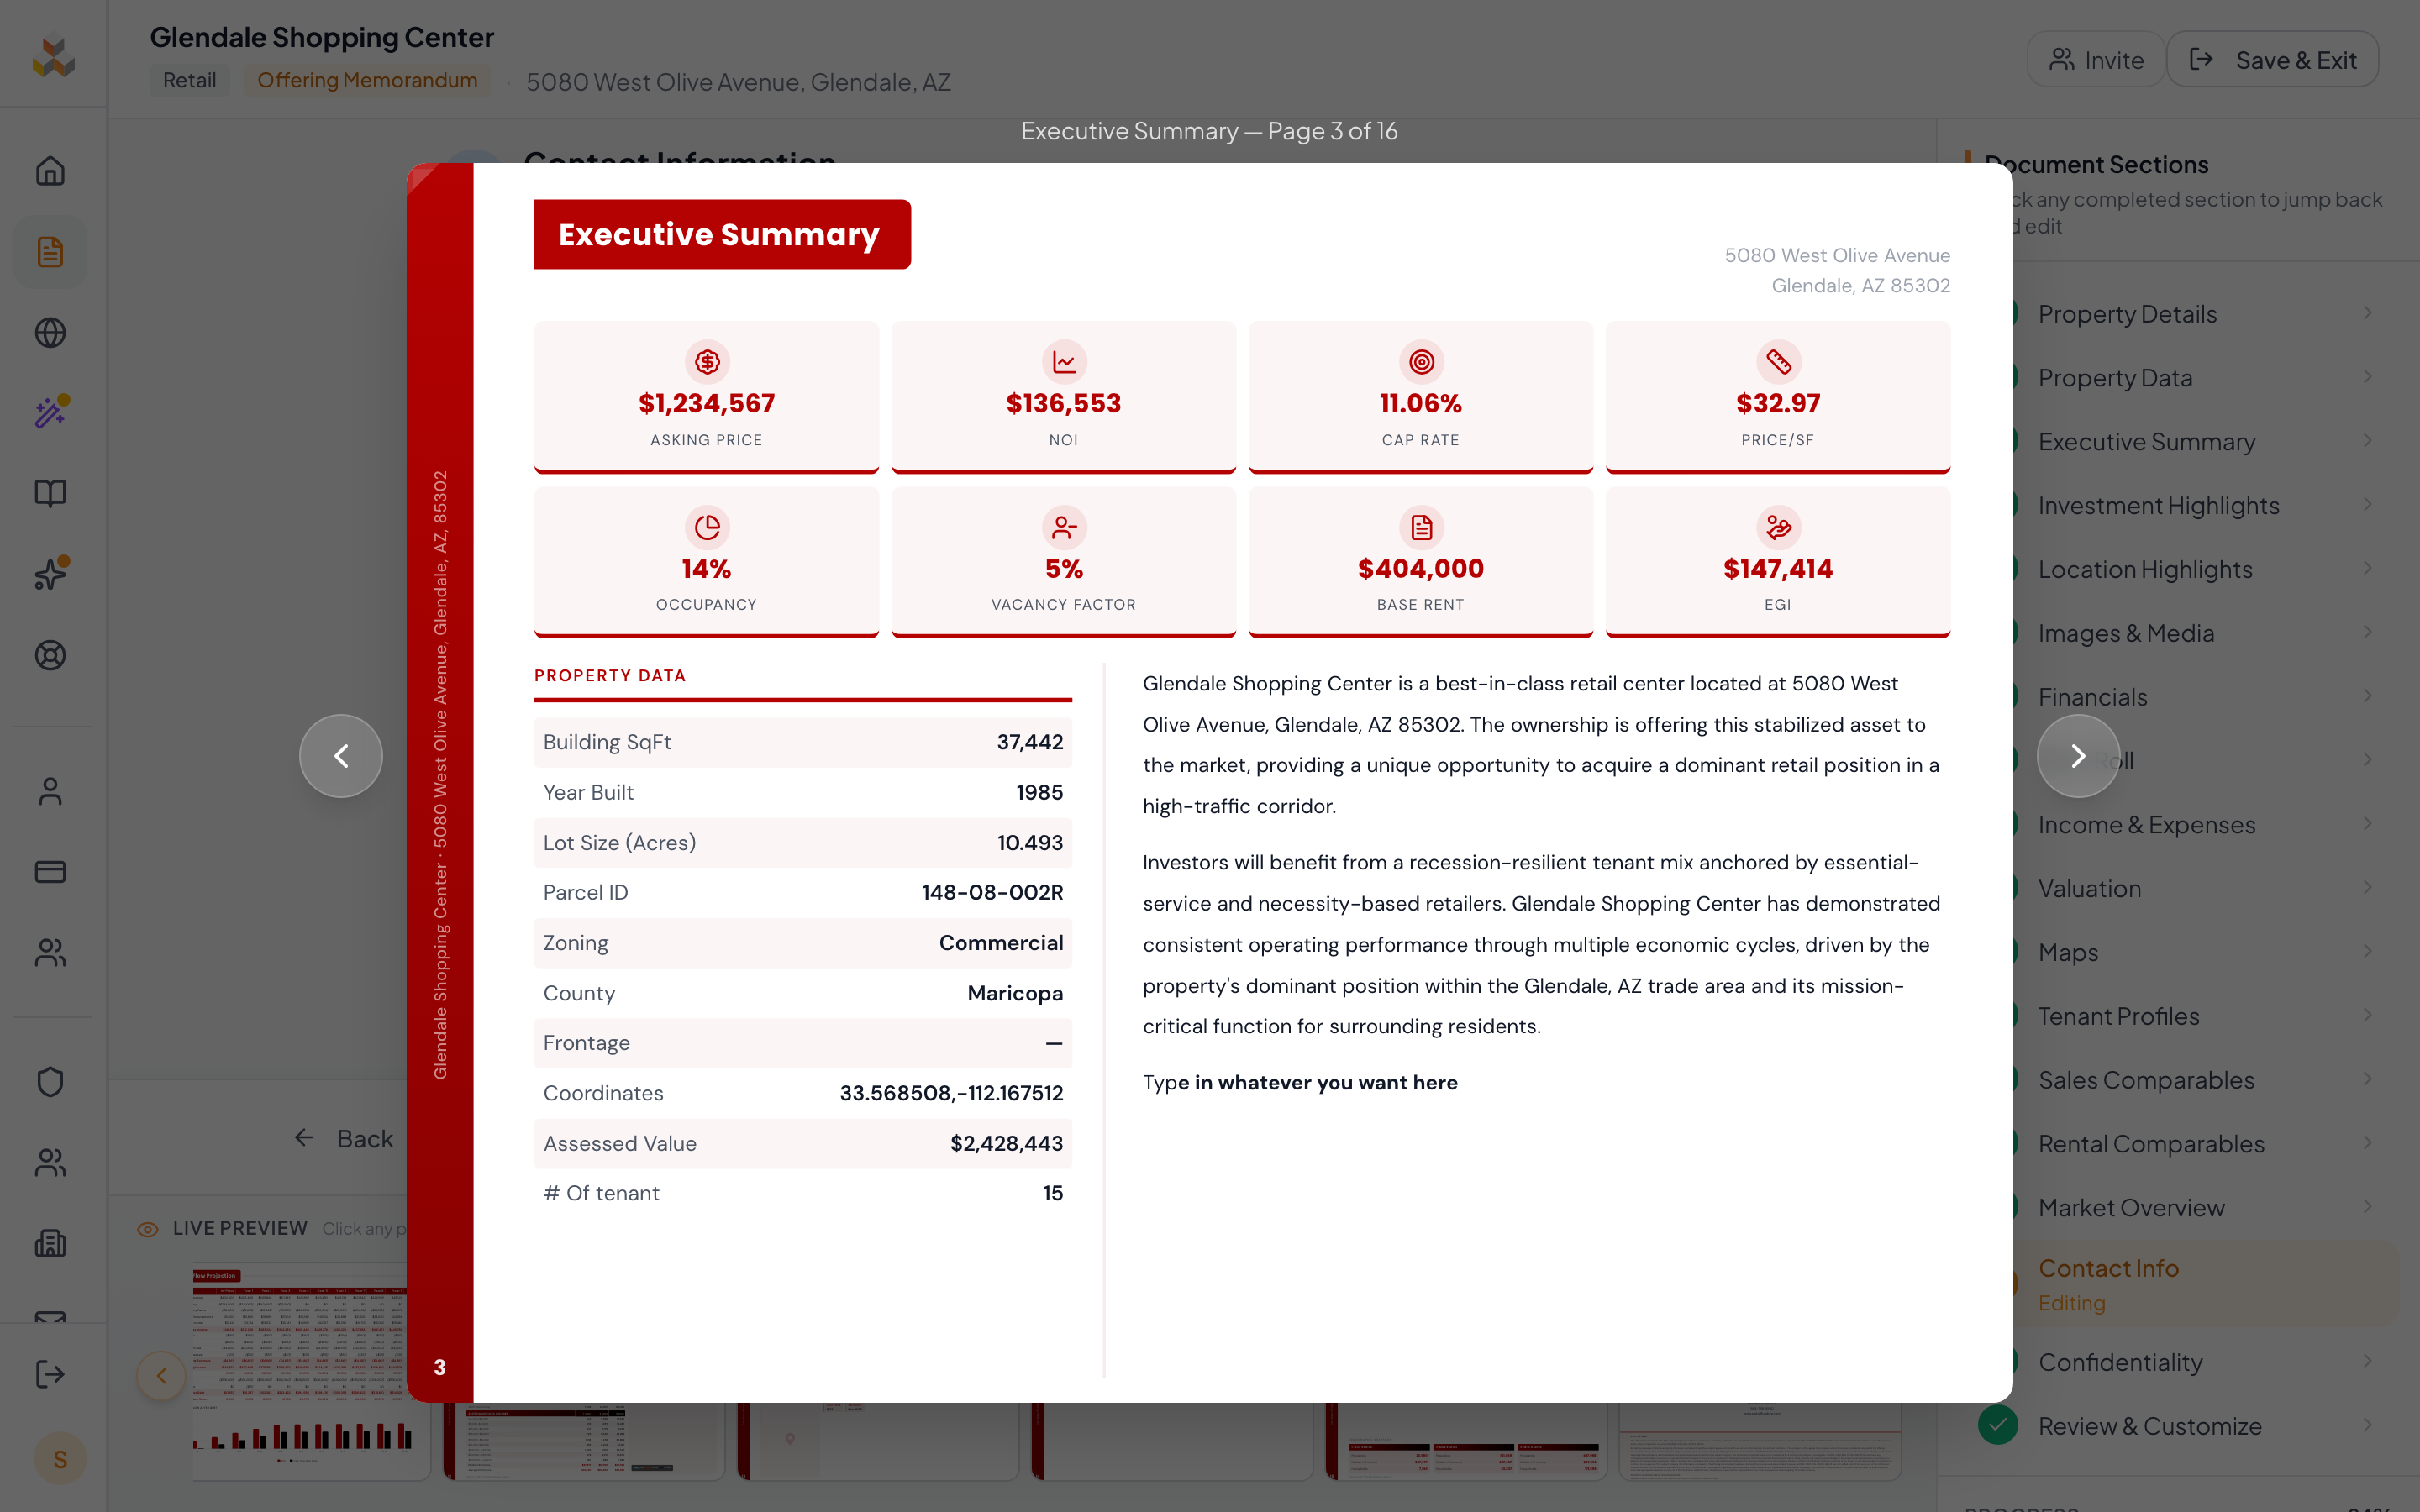
7. Executive Summary
A 2-3 paragraph overview of the investment opportunity. This is the first content page buyers read after the cover, so it should capture attention and summarize why this property is worth their time.
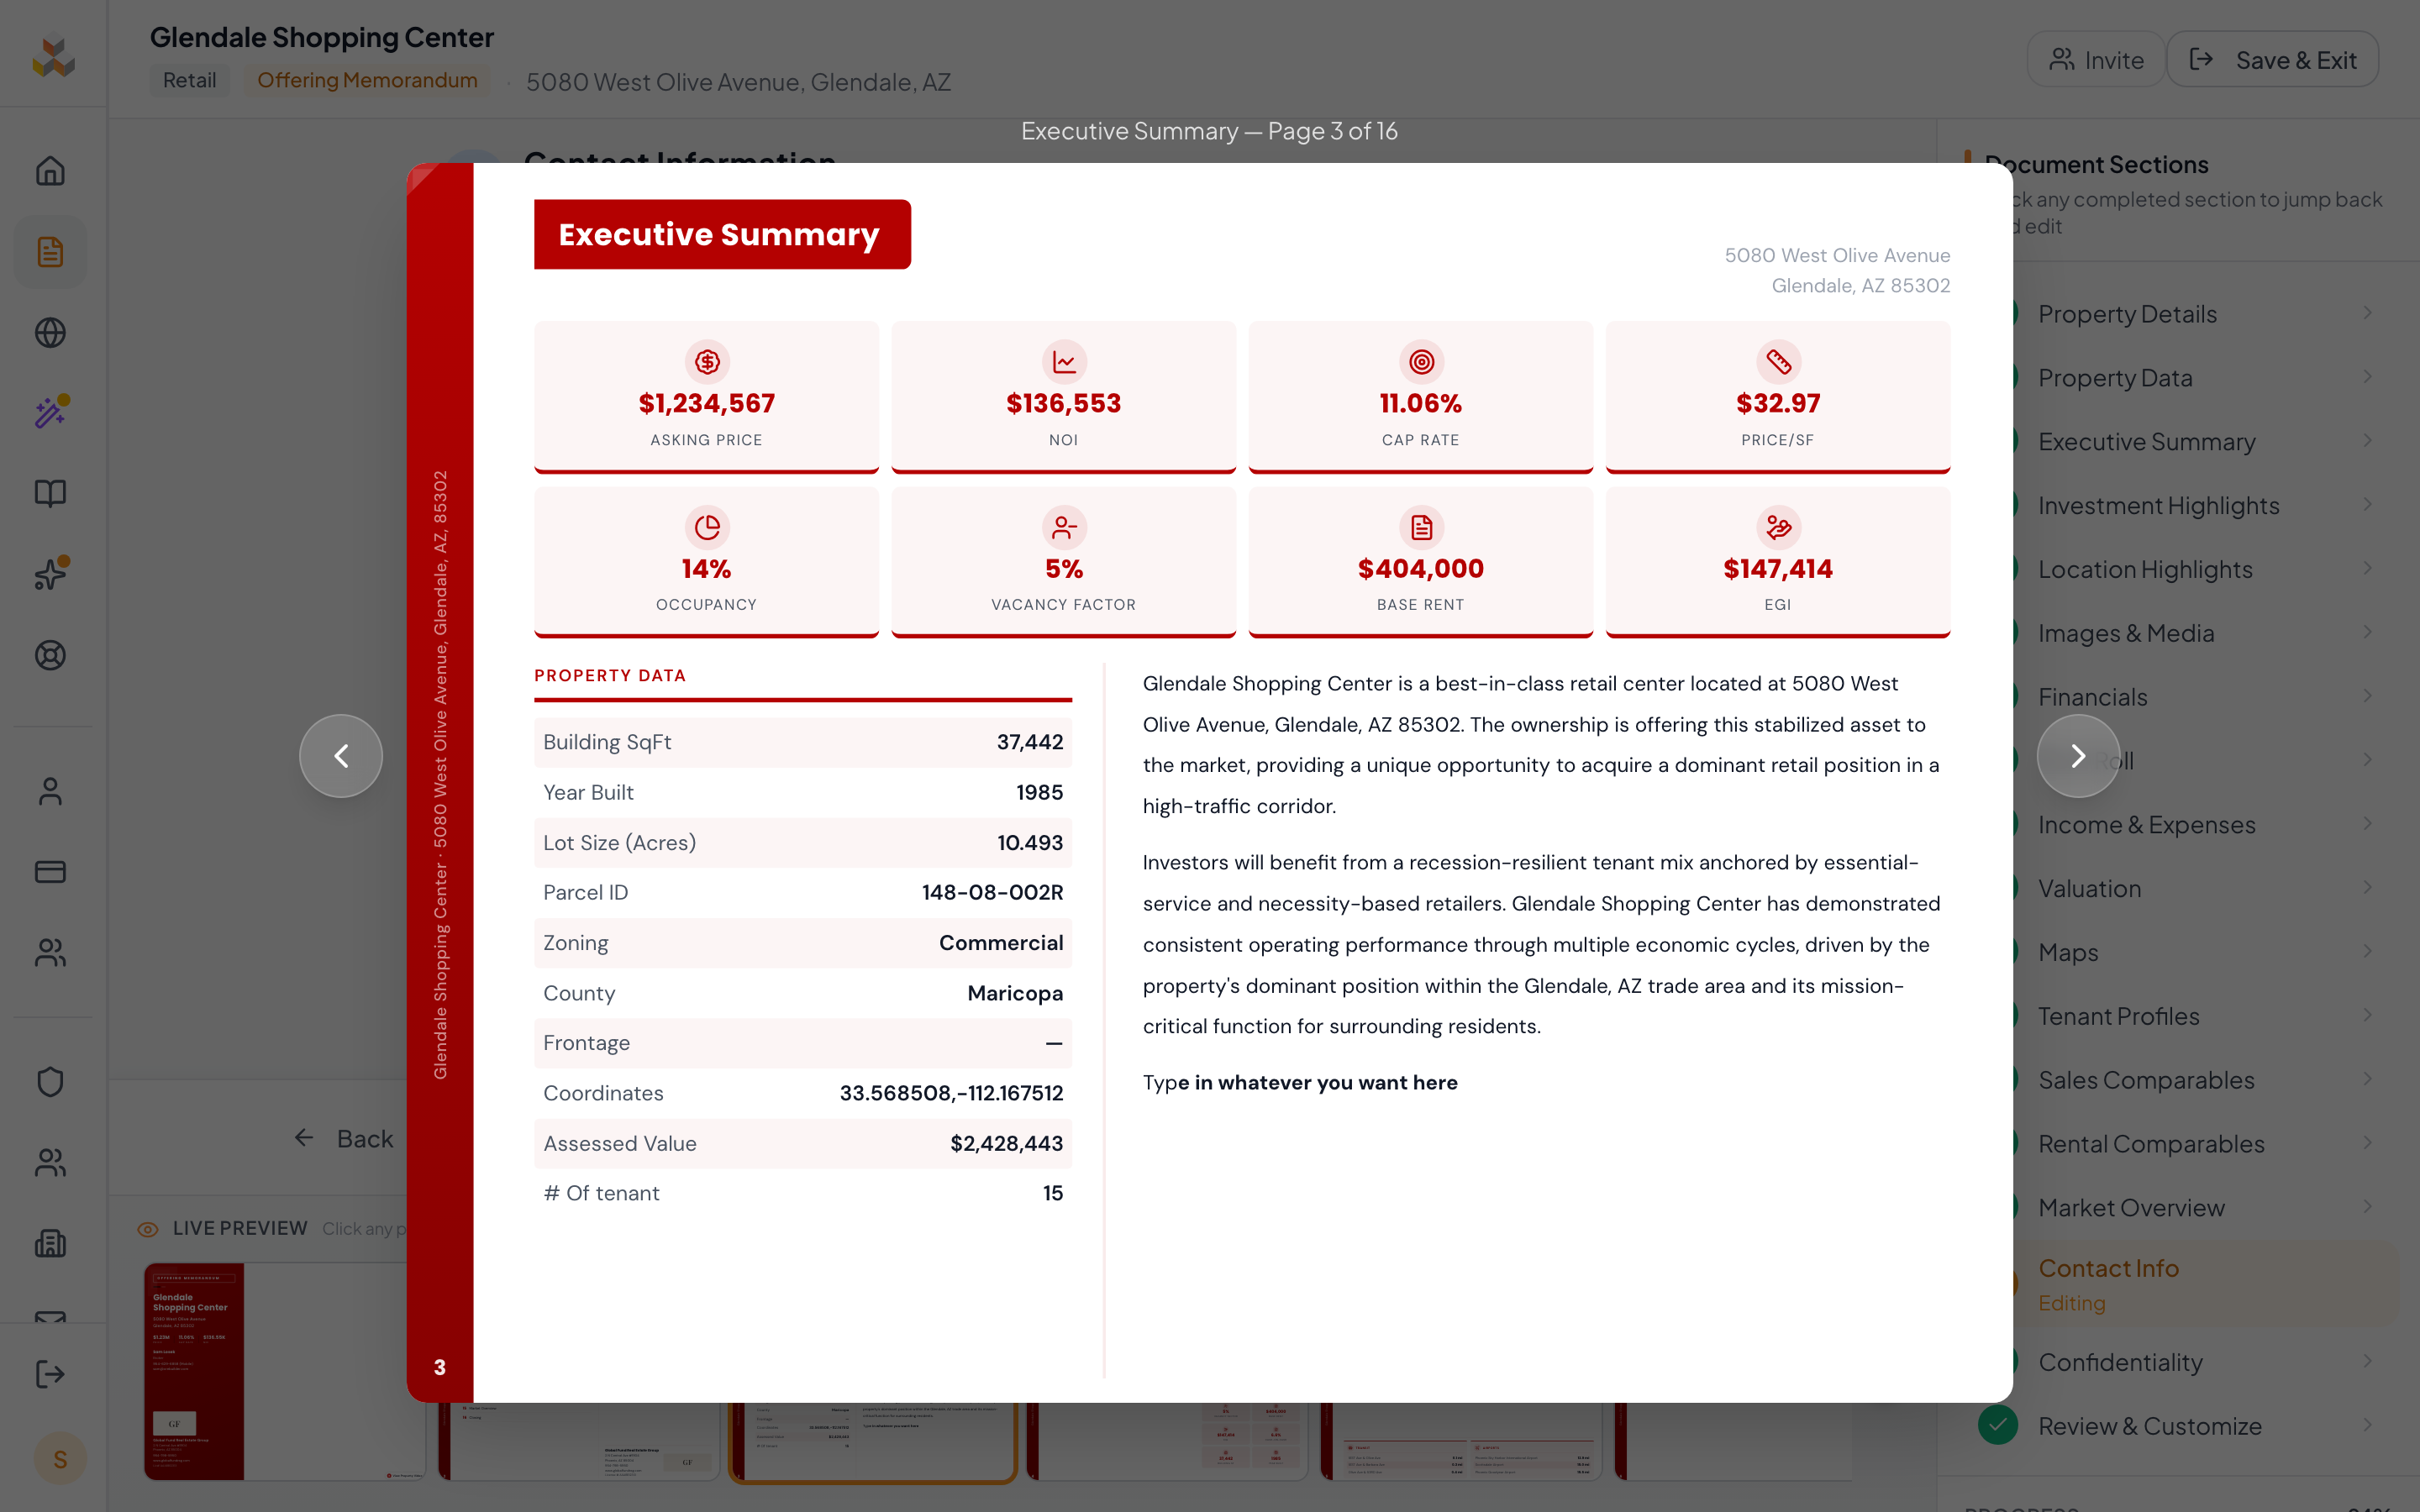
- 1Rich-text editor — Full-featured editor with bold, italic, bullet lists, and paragraph formatting. The formatting carries through to the final PDF.
- 2Category tabs — Switch between Opening Statement, Property Description, Location & Access, Investment Thesis, and Closing Statement. Each tab seeds different AI suggestions.
- 3AI suggestions — Property-type-aware suggestion chips. Click one to insert it into the editor, then customize for your property. Suggestions also work for multi-property and portfolio docs (the panel reads the buildings' property types when the doc-level type is empty).
Lead with the strongest selling point — location advantage, below-market rents, strong tenancy, or value-add potential. Buyers skim the first paragraph.
8. Investment Highlights
Bullet-point list of the top investment features. The Key Metrics panel on the right configures the prominent stats that appear on the cover and on the Investment Highlights page itself.

- 1Highlights editor — Bullet points covering financial advantages, value-add potential, market positioning, and unique features. AI suggestions feed inspiration.
- 2Key Metrics panel — Configure the 4-6 metrics shown prominently on the cover (e.g., Cap Rate, NOI, Price/SF, Occupancy). "Auto" metrics recalculate from your financials; "Custom" or "Preset" metrics are locked to what you type.
Lead with the strongest metric. If your cap rate is above market average, put that first. If the property is 100% occupied, lead with tenancy stability.
9. Location Highlights
Describe location advantages, nearby amenities, and area context. The Transportation panel on the right auto-finds nearby transit stations, airports, and major highways based on the property's coordinates.

- 1Location editor — Neighborhood context, traffic patterns, nearby retailers, employment centers, demographic advantages. AI suggestions group by Strategic Position, Growth & Demographics, and Transportation.
- 2Transportation panel — Automatically populated from nearby transit stations, airports, and highways. Toggle items on/off to control what appears in the final document.
Specific distances read better than generic adjacency. "3 miles from Phoenix Sky Harbor Airport" beats "close to the airport."
10. Images & Media
Upload and organize the property photography that appears in your document. Four zone types control the page layouts in the final PDF.
- 1Cover Image — The hero photo on the cover page. One image only — use your best exterior or aerial shot.
- 2Single-Page Images — Each image gets its own full page in the document. Great for hero shots, aerials, or site plans that earn the full spotlight.
- 3Multi-Image Page — Gallery pages with up to 8 images in a grid layout. Perfect for interior photos and amenity shots that work well together.
- 4Property Video — Paste a YouTube, Vimeo, or self-hosted video URL. The video appears three places: a small "View Property Video" play badge on the cover, a matching link beside the Key Facts on the Property Summary, and an embedded player on your public Property Hub. Works on OMs, Sales Teasers, and Leasing Packages.
Upload photos at the highest resolution available. CREBuilder transcodes to JPEG for PDF compatibility (WebP and AVIF inputs are converted automatically). Landscape orientation works best for cover photos.
11. Maps
Branded maps for your document. The built-in Map Builder creates retail maps with business logos, custom styling, and professional annotations — all without leaving the app. For multi-property and portfolio docs, the Maps step also feeds the multi-marker portfolio map shown on the Location page.
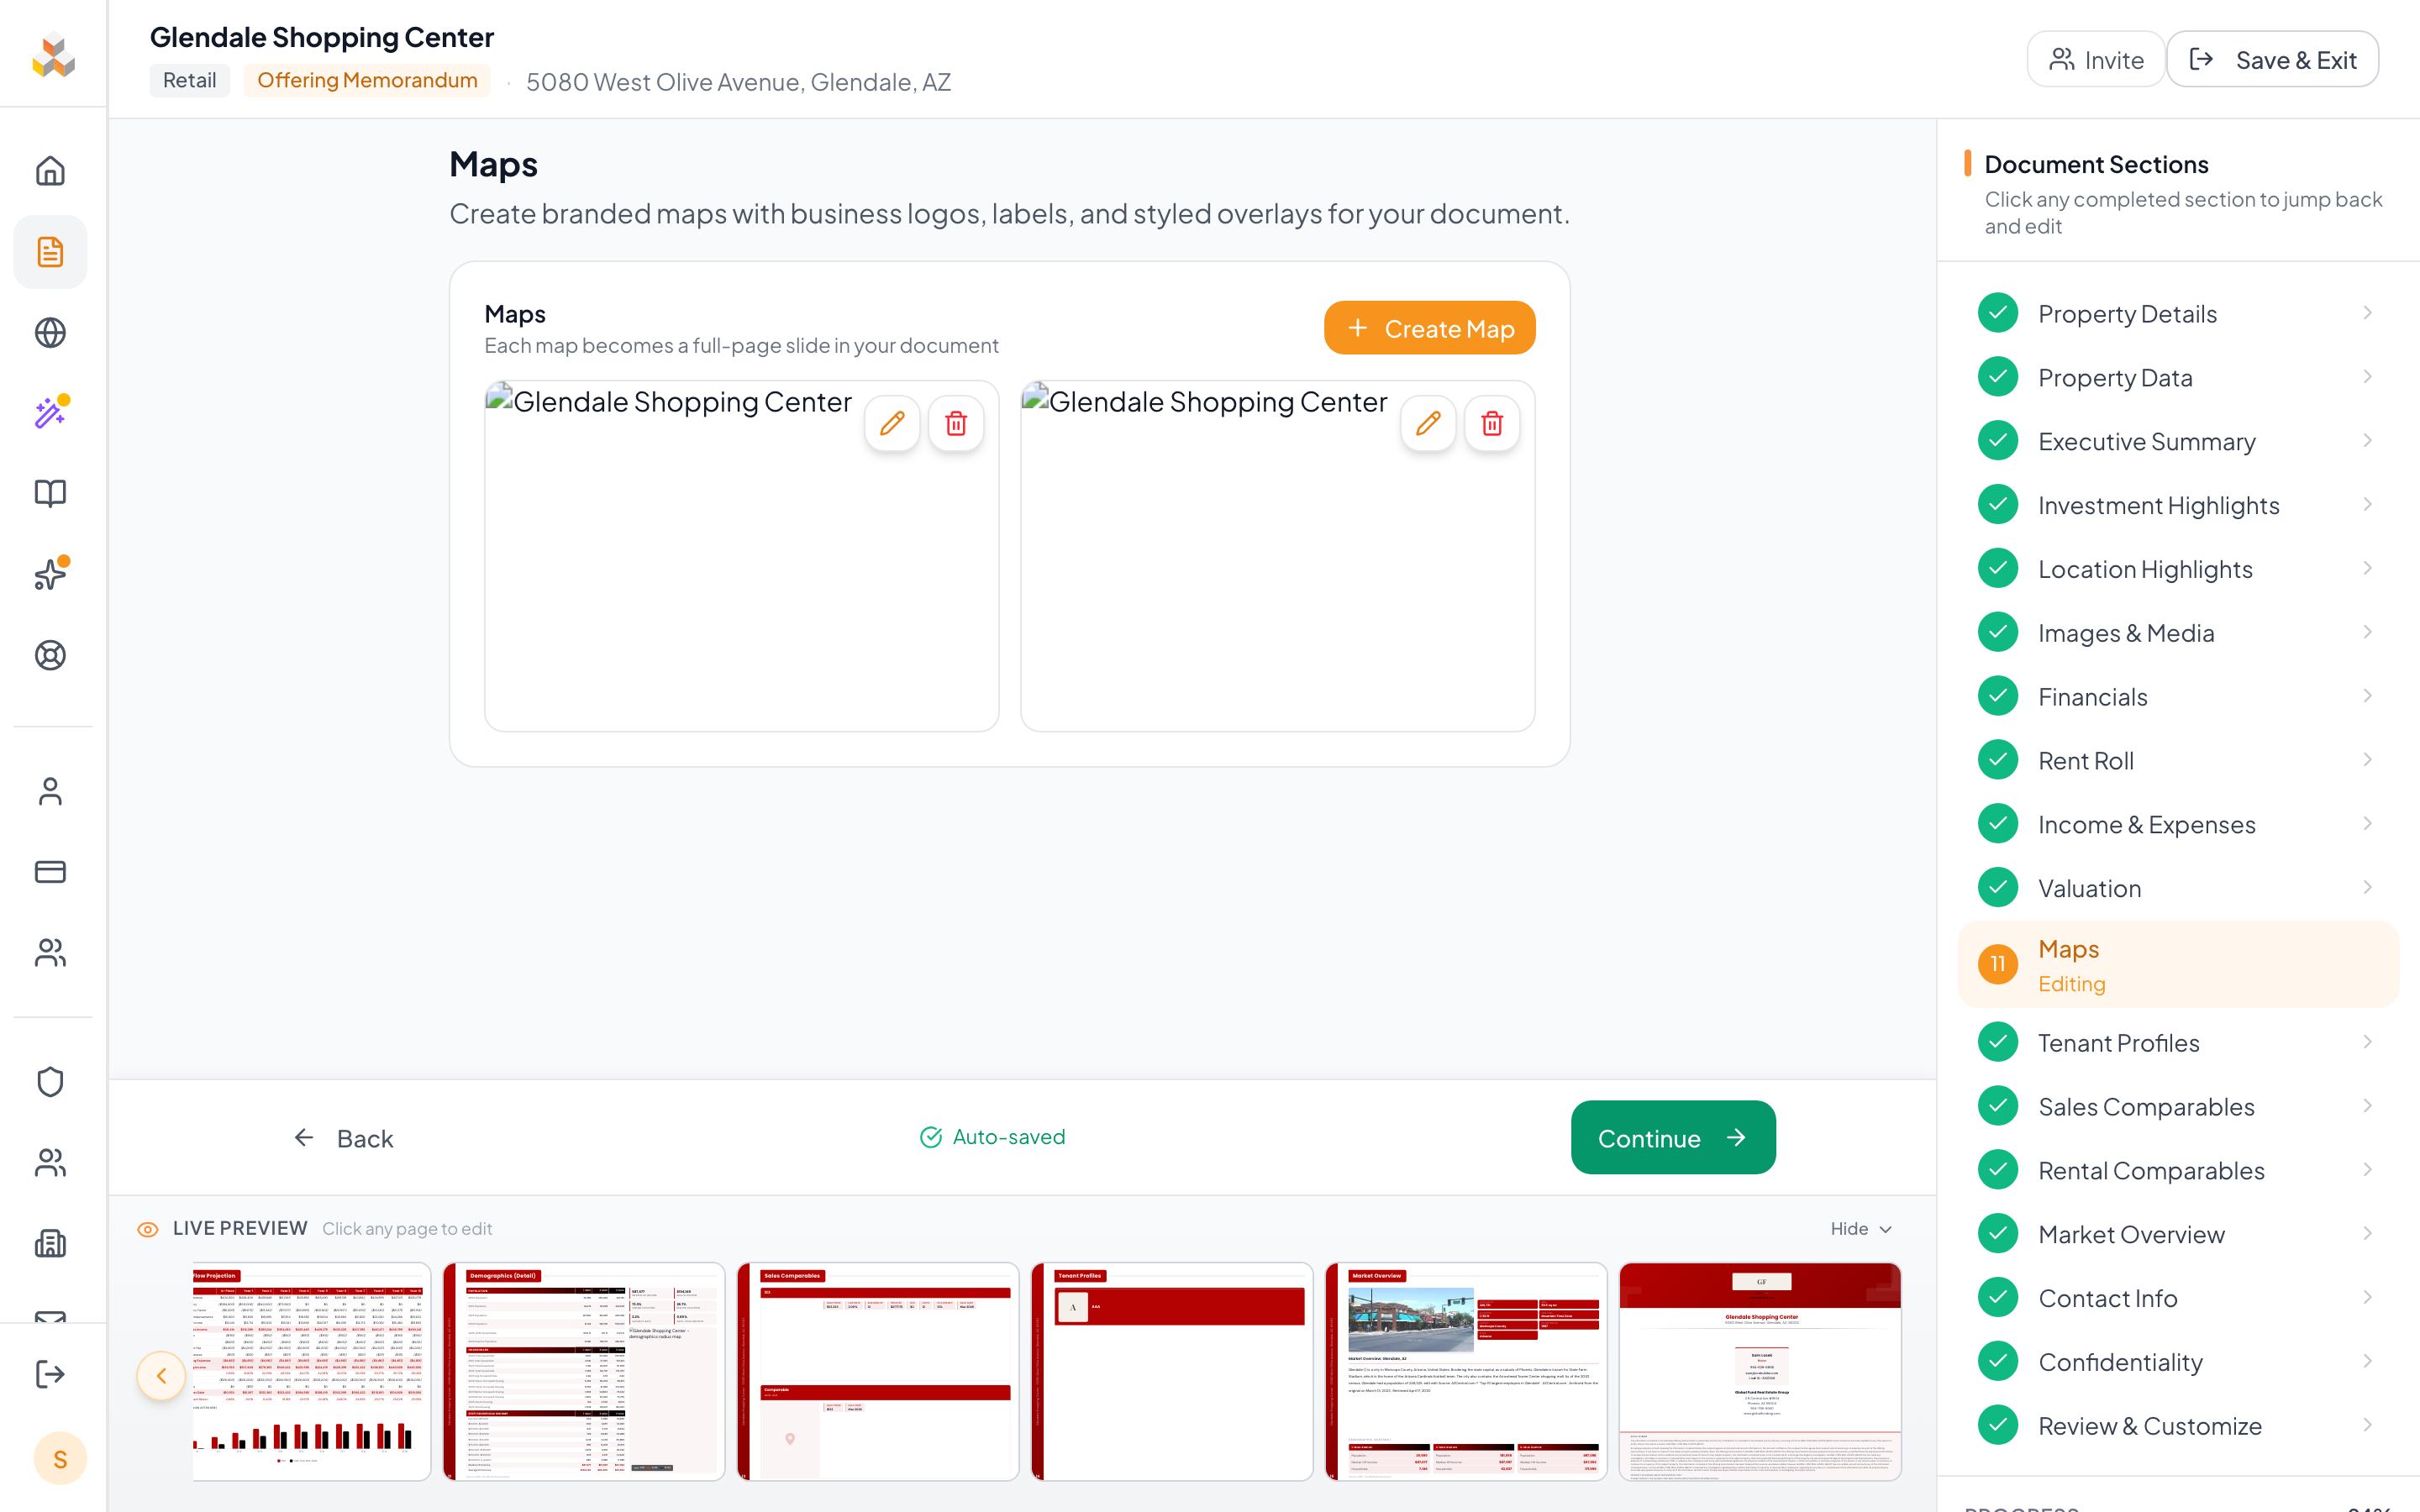
- 1Map cards — Saved maps appear as cards with a preview thumbnail. Click any card to re-open the Map Builder editor.
- 2Create Map — Opens the interactive Map Builder where you can search for businesses, drop logos, customize colors, adjust zoom, and annotate.
When you create a retail map, the Map Builder auto-detects nearby businesses and pre-loads their logos for you to drag onto the map — saves hours of work versus building one in PowerPoint.
12. Financial Scope
Before entering financial data, choose how much detail to include. This selection controls which financial pages appear in your final document. You can change this anytime if the deal evolves.
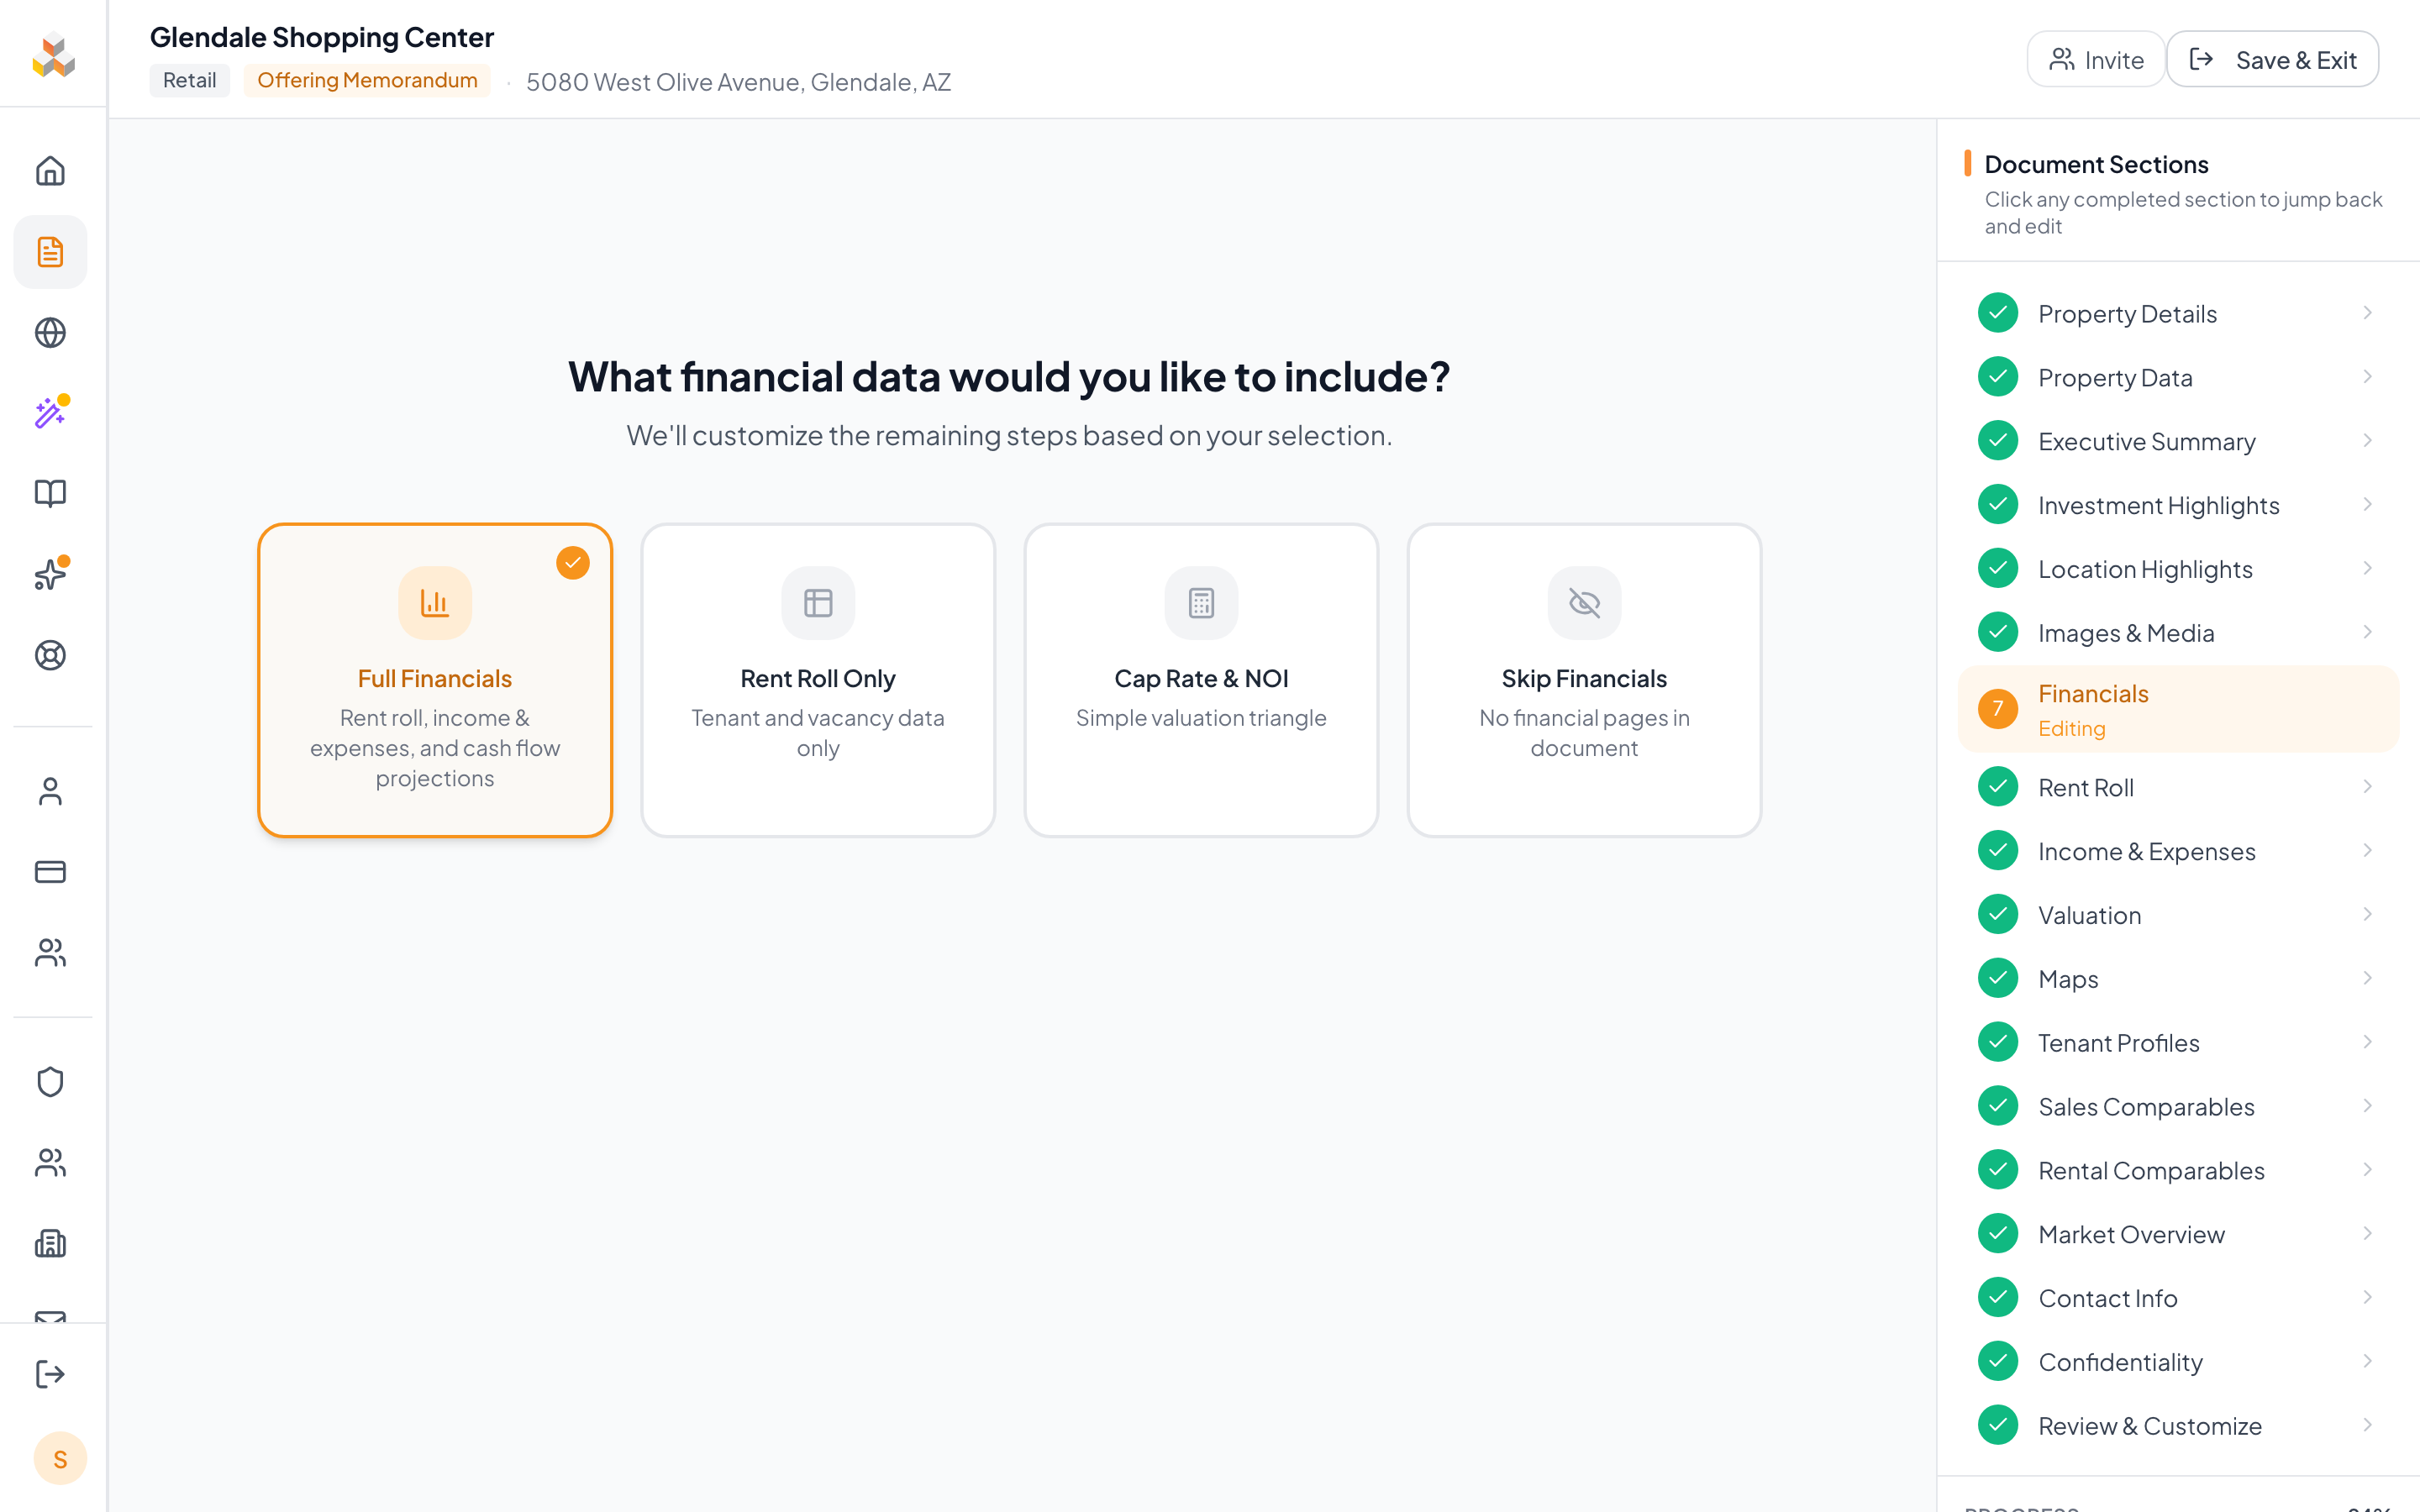
- 1Full Financials — The most comprehensive option. Rent roll + income & expenses + valuation + cash flow projections. Pick this when you have BOTH a rent roll AND expense numbers.
- 2Rent Roll Only — Tenant data + occupancy without detailed income/expense analysis. Pick this for NNN-leased properties where the tenant handles operating costs, or when you have rents but no expense data.
- 3Cap Rate & NOI — Simple valuation display showing Cap Rate, NOI, and Price. Pick this when your broker only gave you a price and a cap rate, no detailed rent roll.
- 4Skip Financials — Omit all financial pages. Pick this for raw land deals, development sites, or situations where financials are shared separately under NDA.
When in doubt, start with Full Financials — it can always be dialed back. Land deals and pure dev sites are the only ones that should use Skip from the start.
13. Rent Roll
The rent roll is the backbone of your financial analysis — it feeds income calculations, occupancy metrics, and cash flow projections throughout the document.
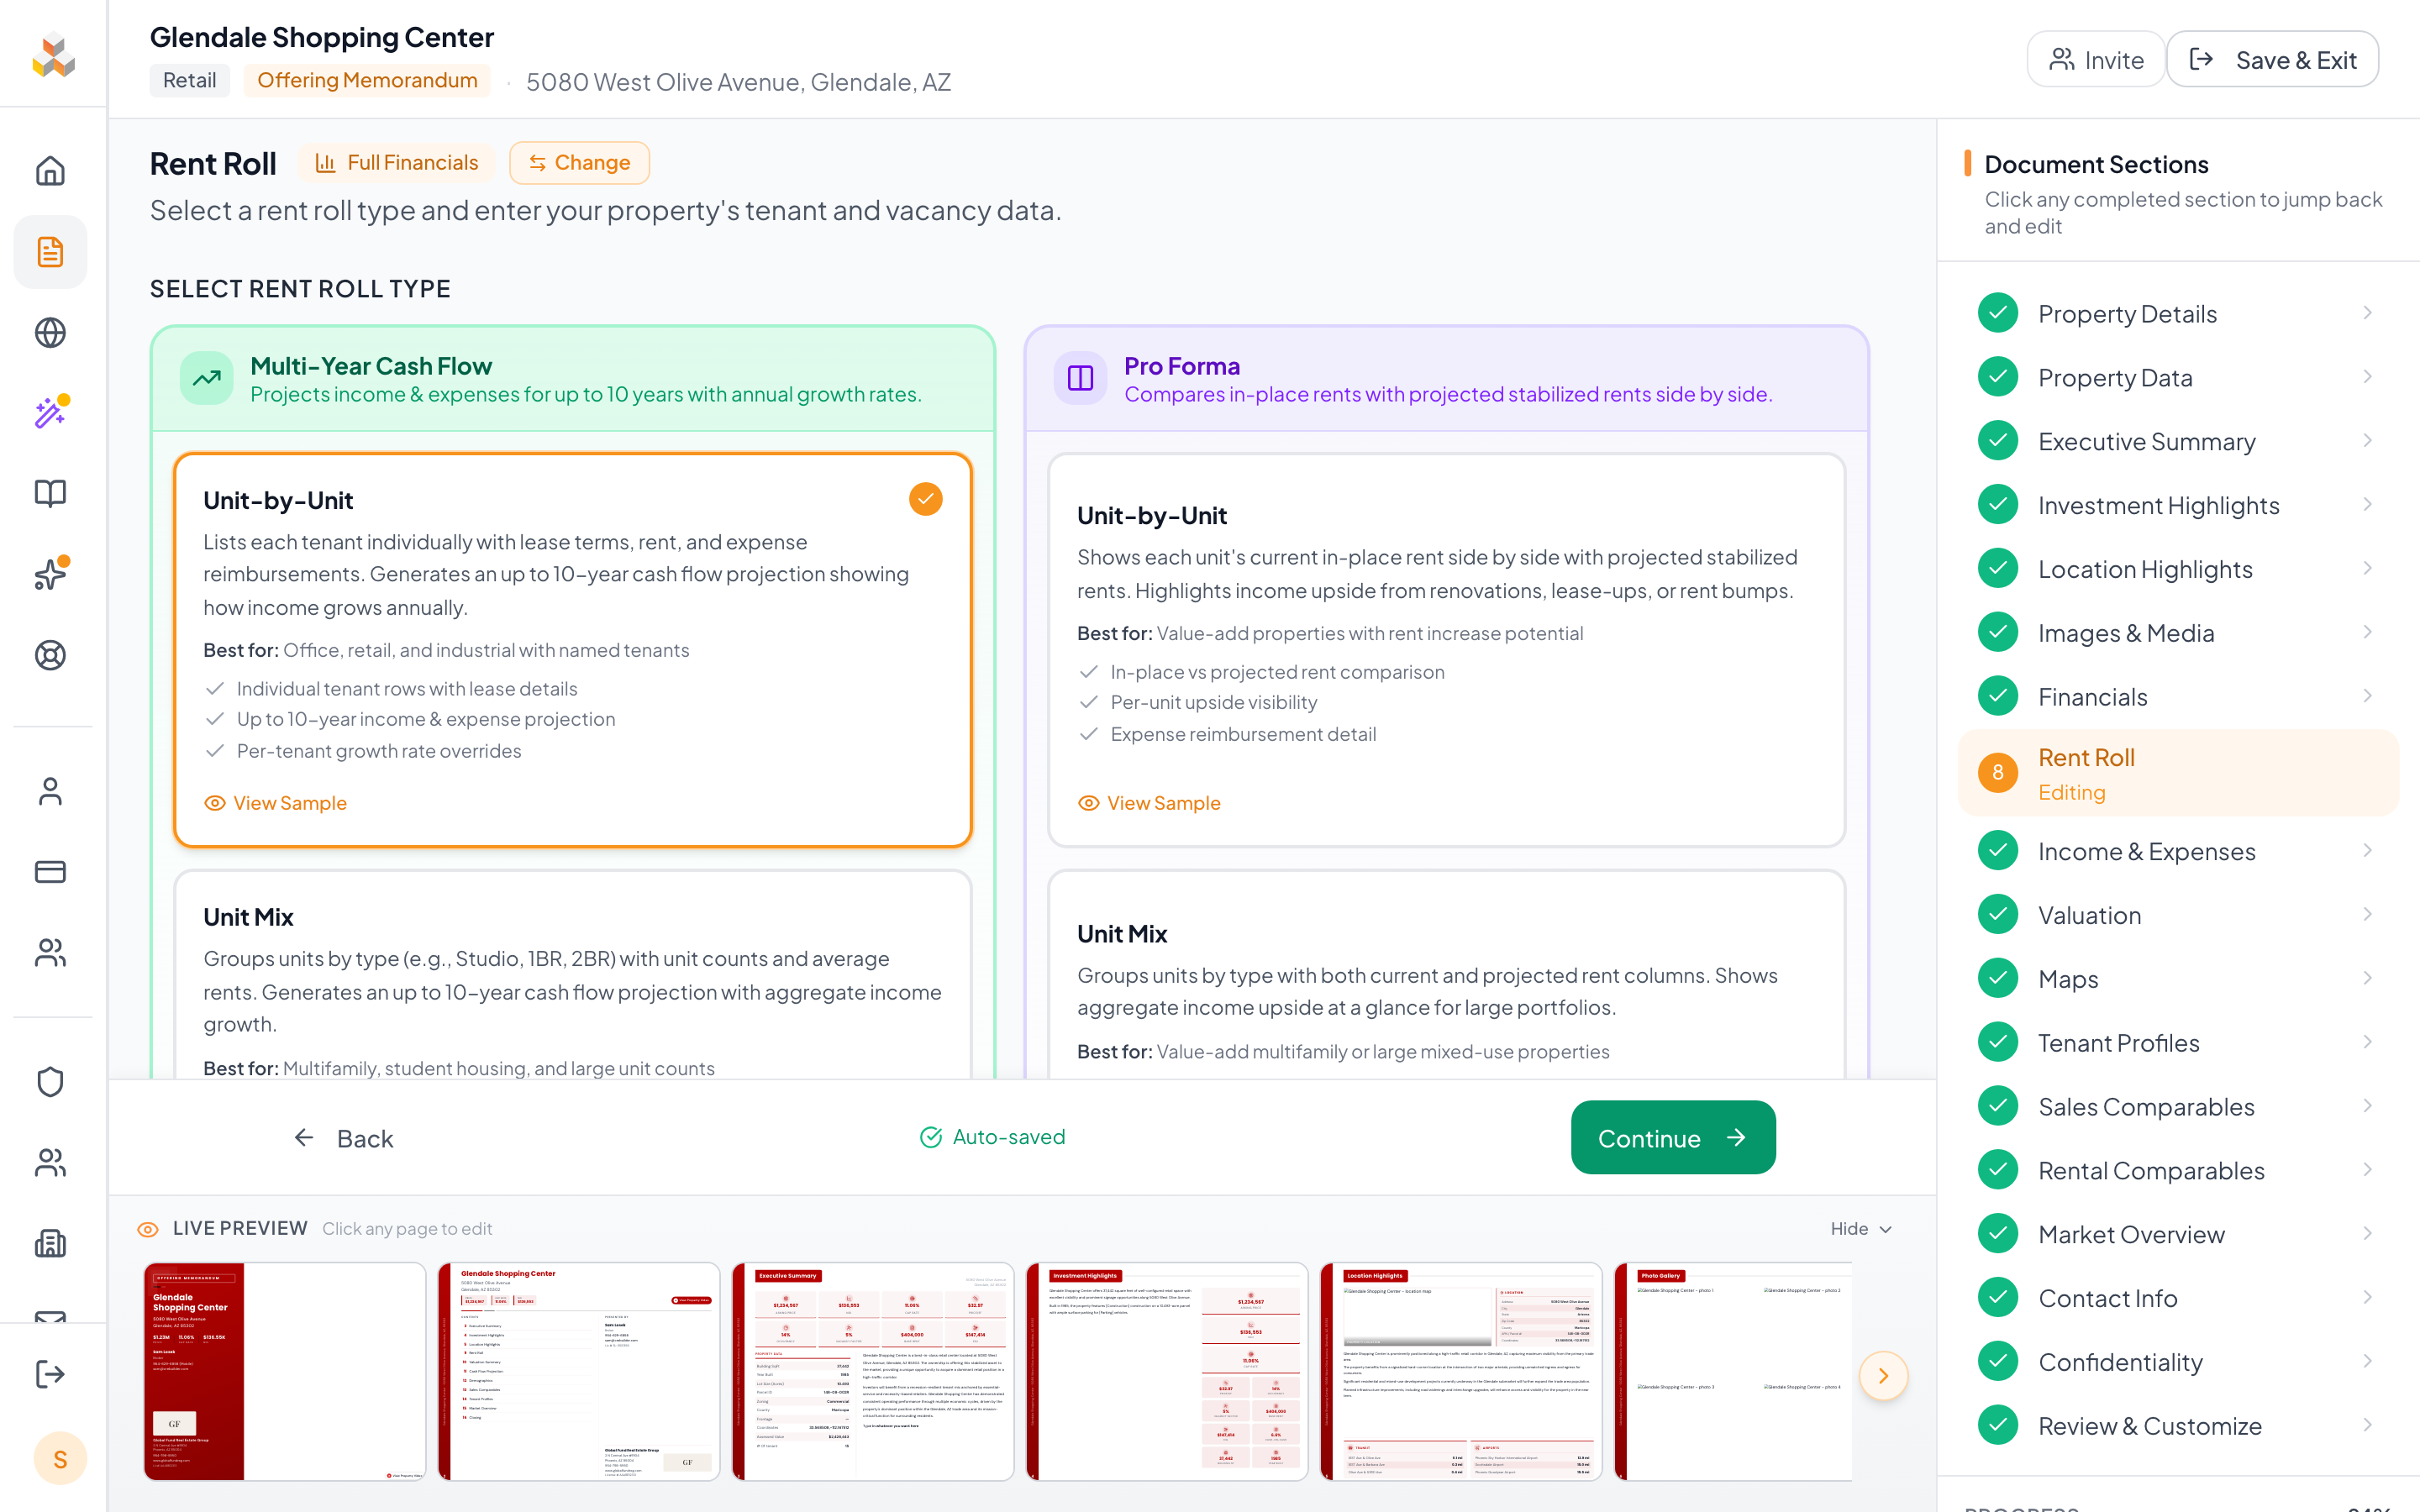
- 1Type selector — Cash Flow vs Pro Forma — Multi-Year Cash Flow projects income + expenses out 5-10 years with growth rates. Pro Forma compares in-place rents to projected stabilized rents side-by-side. Pick Cash Flow for stabilized deals with clean leases and growth assumptions. Pick Pro Forma when there's clear rent upside — vacant units to lease, below-market rents due for renewal, or planned renovations.
- 2Format — Unit-by-Unit vs Unit Mix — Unit-by-Unit lists each tenant or unit with their lease terms. Unit Mix groups by category (1BR/1BA, 2BR/2BA) with averaged rents. Pick Unit-by-Unit when you have <20 tenants and each lease matters individually (typical retail, office, industrial). Pick Unit Mix for 20+ multifamily units that share floor plans.
The columns and labels adapt to your property type. Multifamily defaults to Unit Mix format (Unit-by-Unit available if needed), Industrial shows clear height, Hospitality shows nightly rate + room count, Mobile Home Parks shows pad rent. The Rent Roll Only scope shrinks the table to just occupancy.
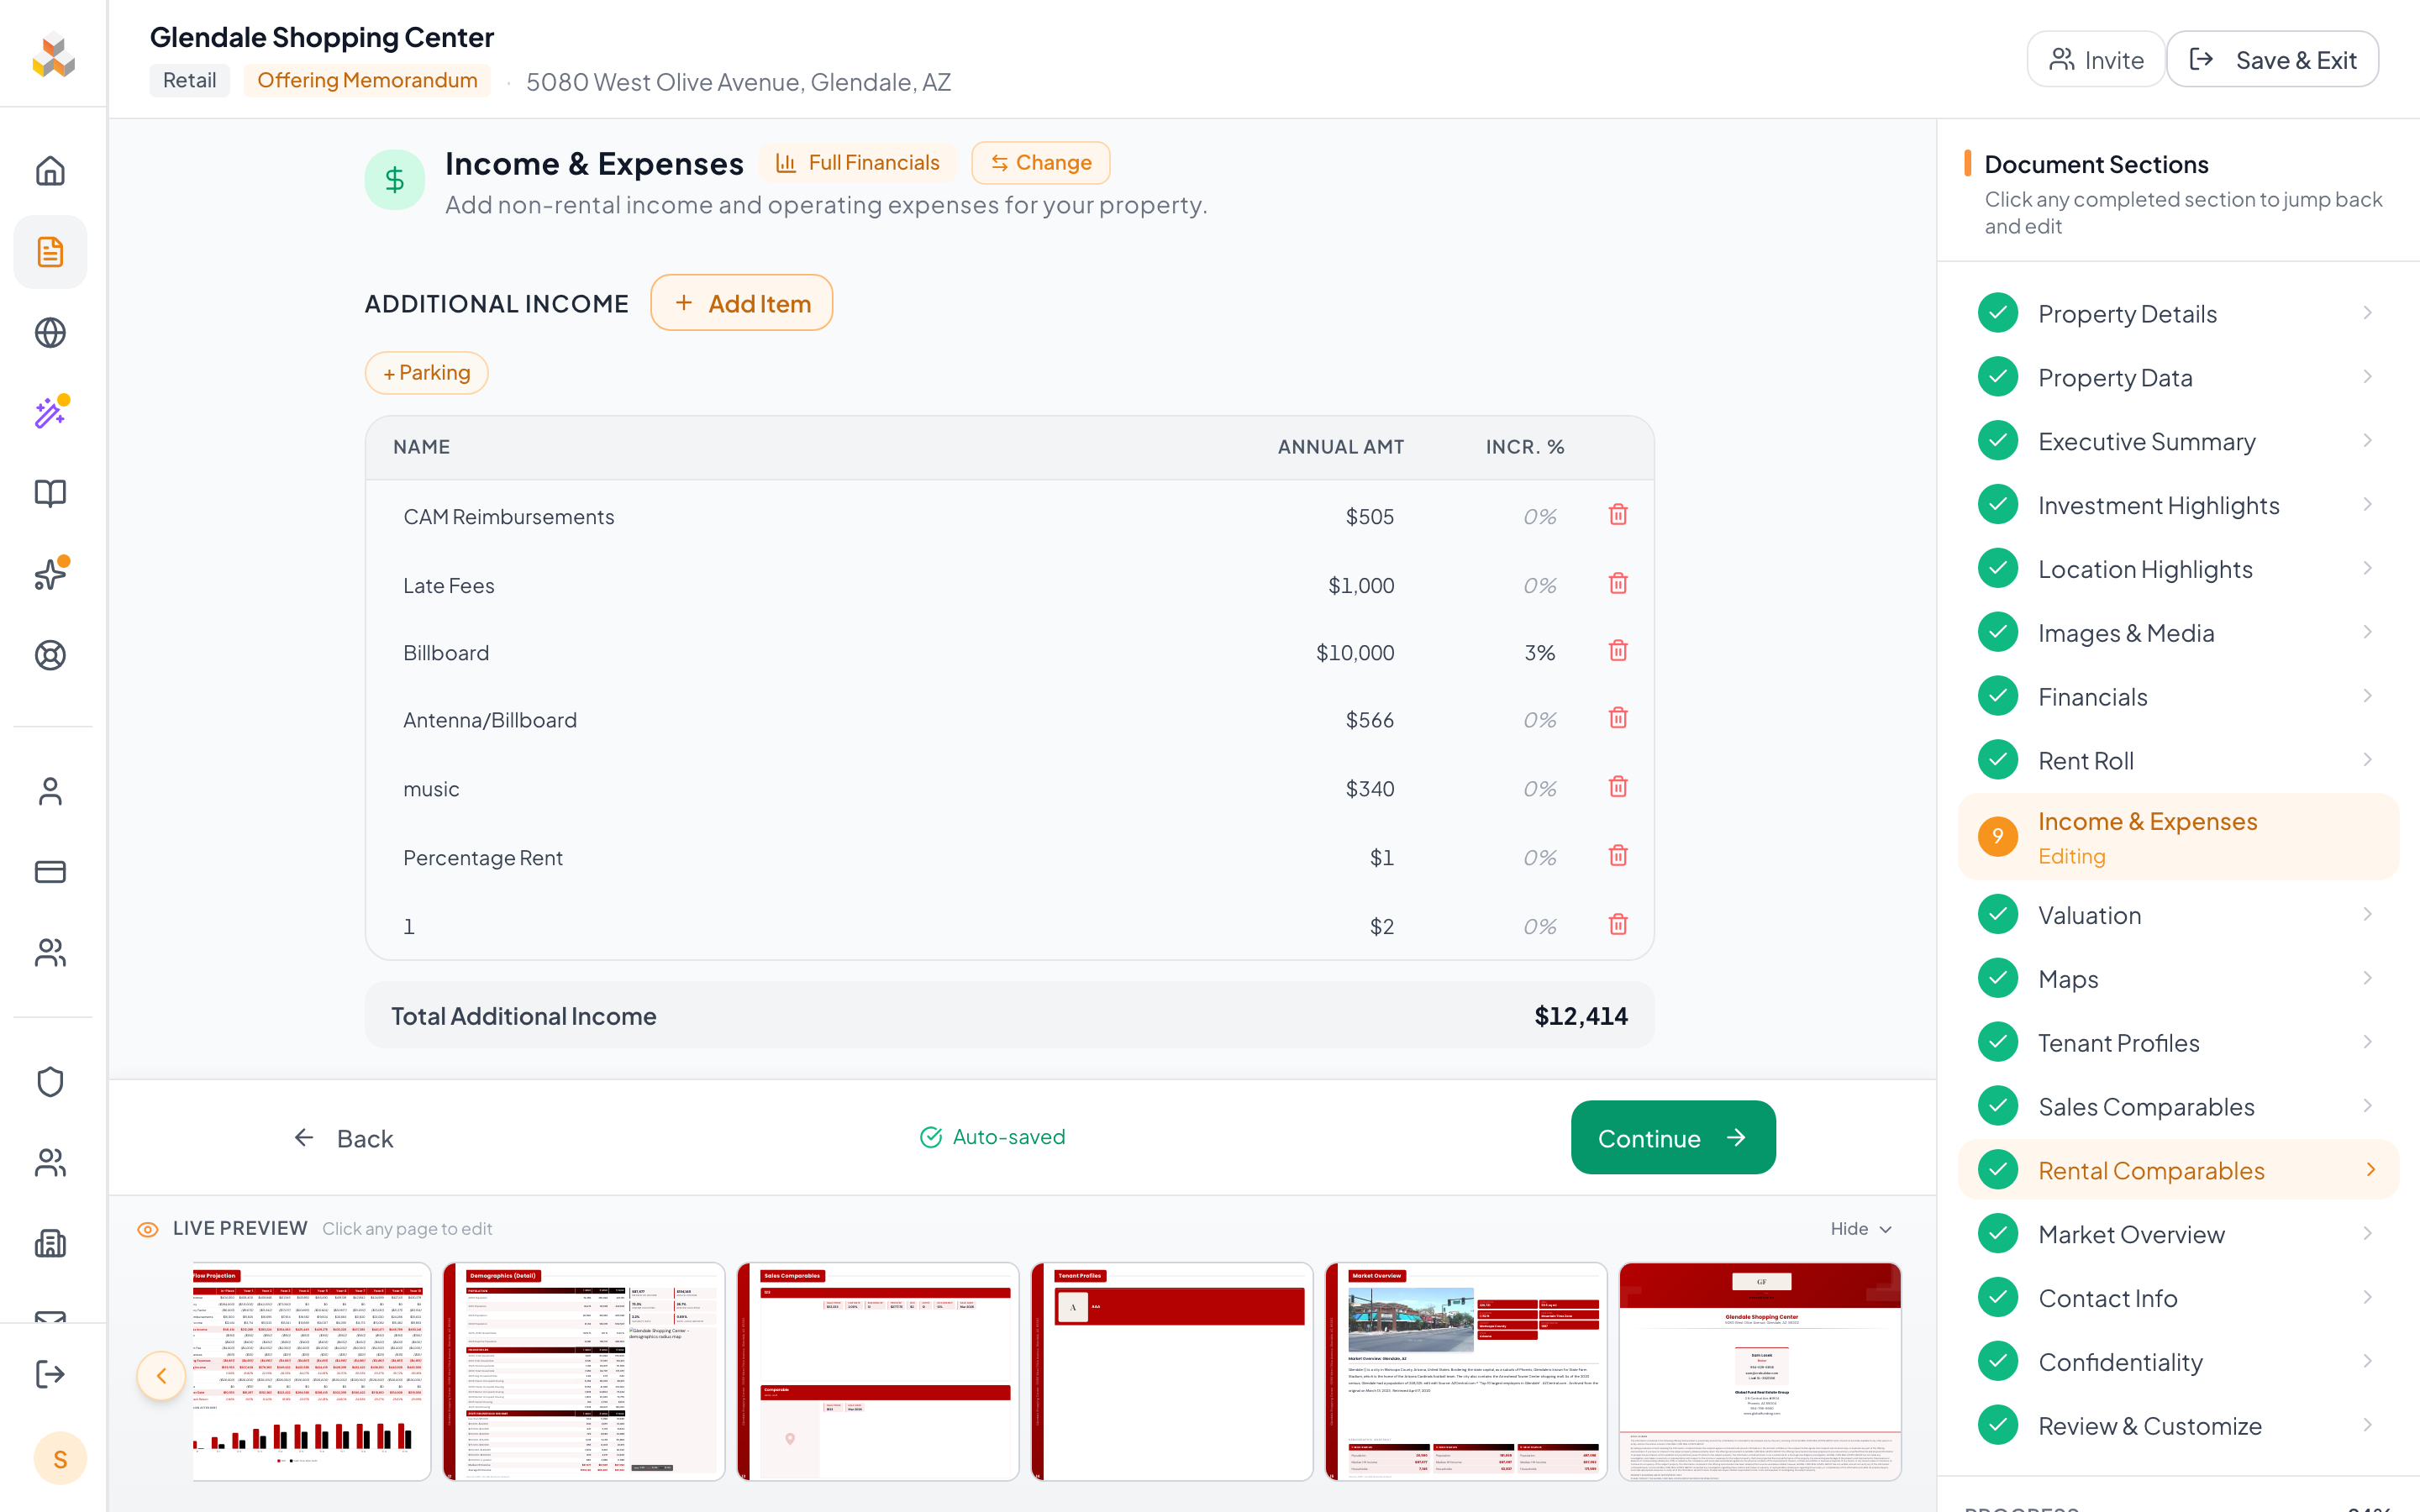
14. Income & Expenses
Build your property pro forma by adding additional income sources and operating expenses. Rental income flows in automatically from the rent roll. The resulting NOI drives the valuation metrics.
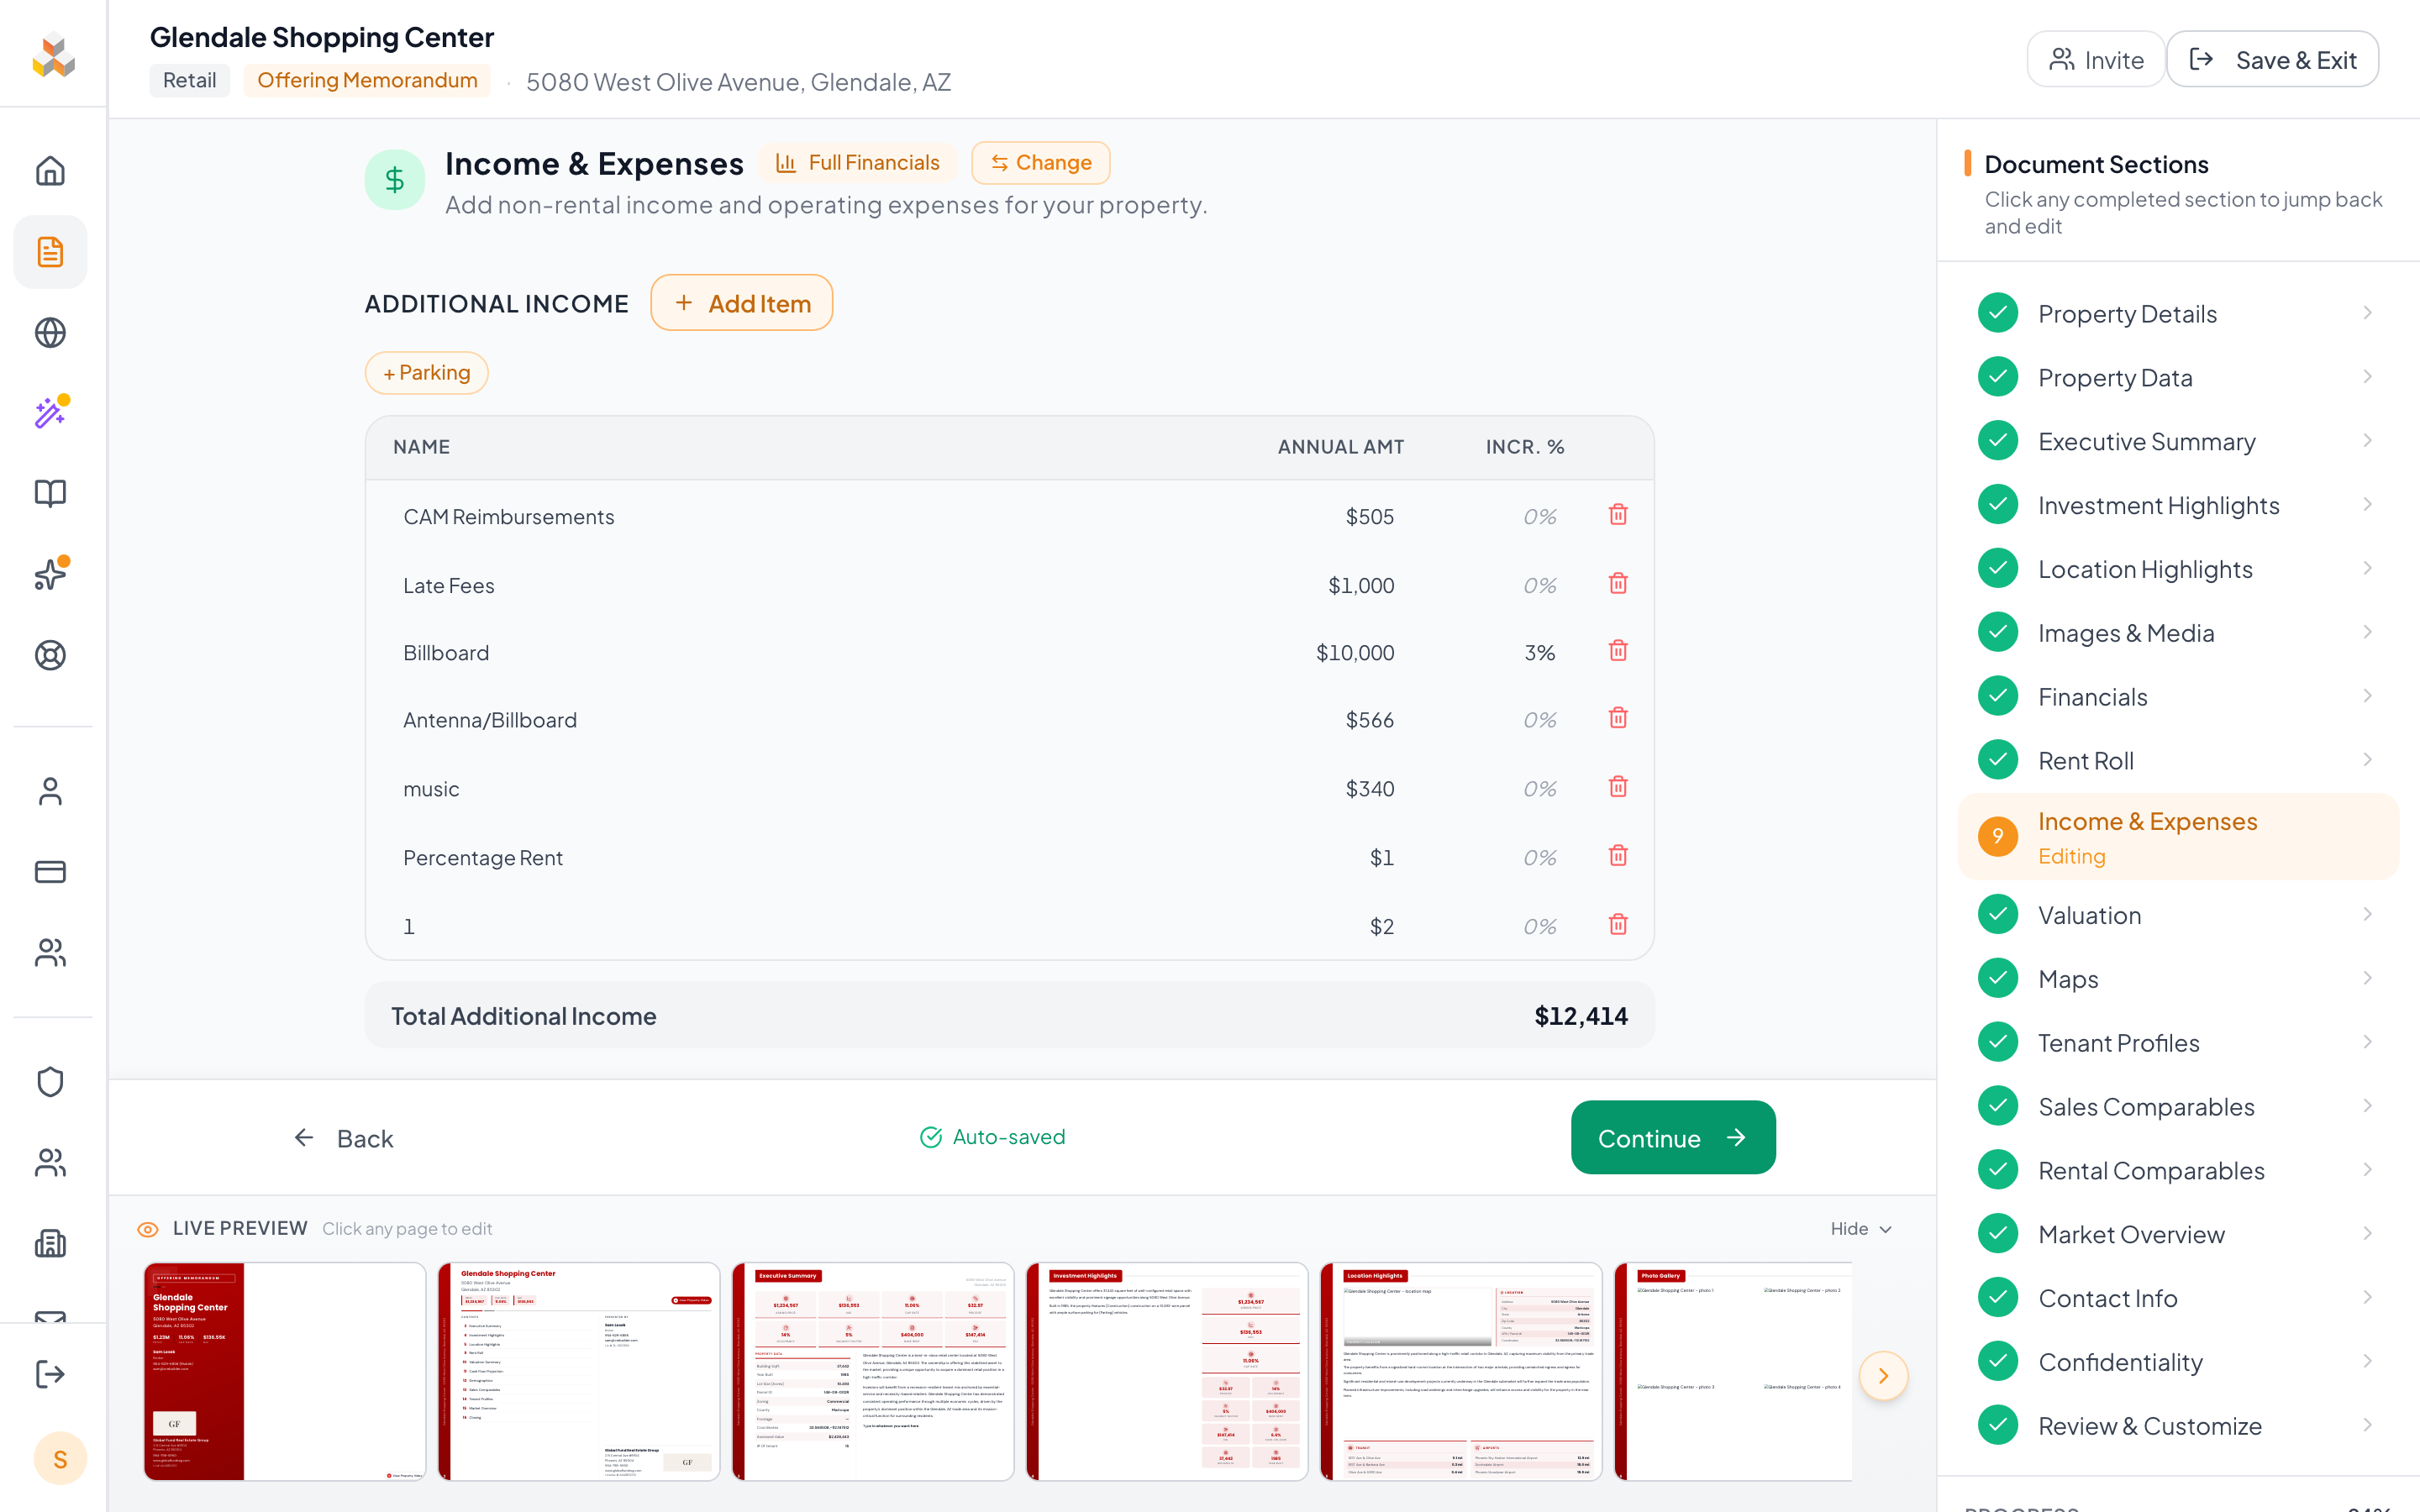
- 1Additional Income — Non-rental income like CAM Reimbursements, Parking Revenue, Laundry Income, Late Fees. Each line shows both In-Place and Pro-Forma amounts when applicable.
- 2Operating Expenses — Property Tax, Insurance, Management Fee, Repairs & Maintenance, Utilities. Default categories pre-populate for convenience; add custom expenses with the "+ Add Expense" button.
If your property is NNN (triple-net), tenants pay most operating expenses — your expense section may be intentionally minimal. Property Tax can be auto-filled from public records via the Lookup button on the Property Data step.
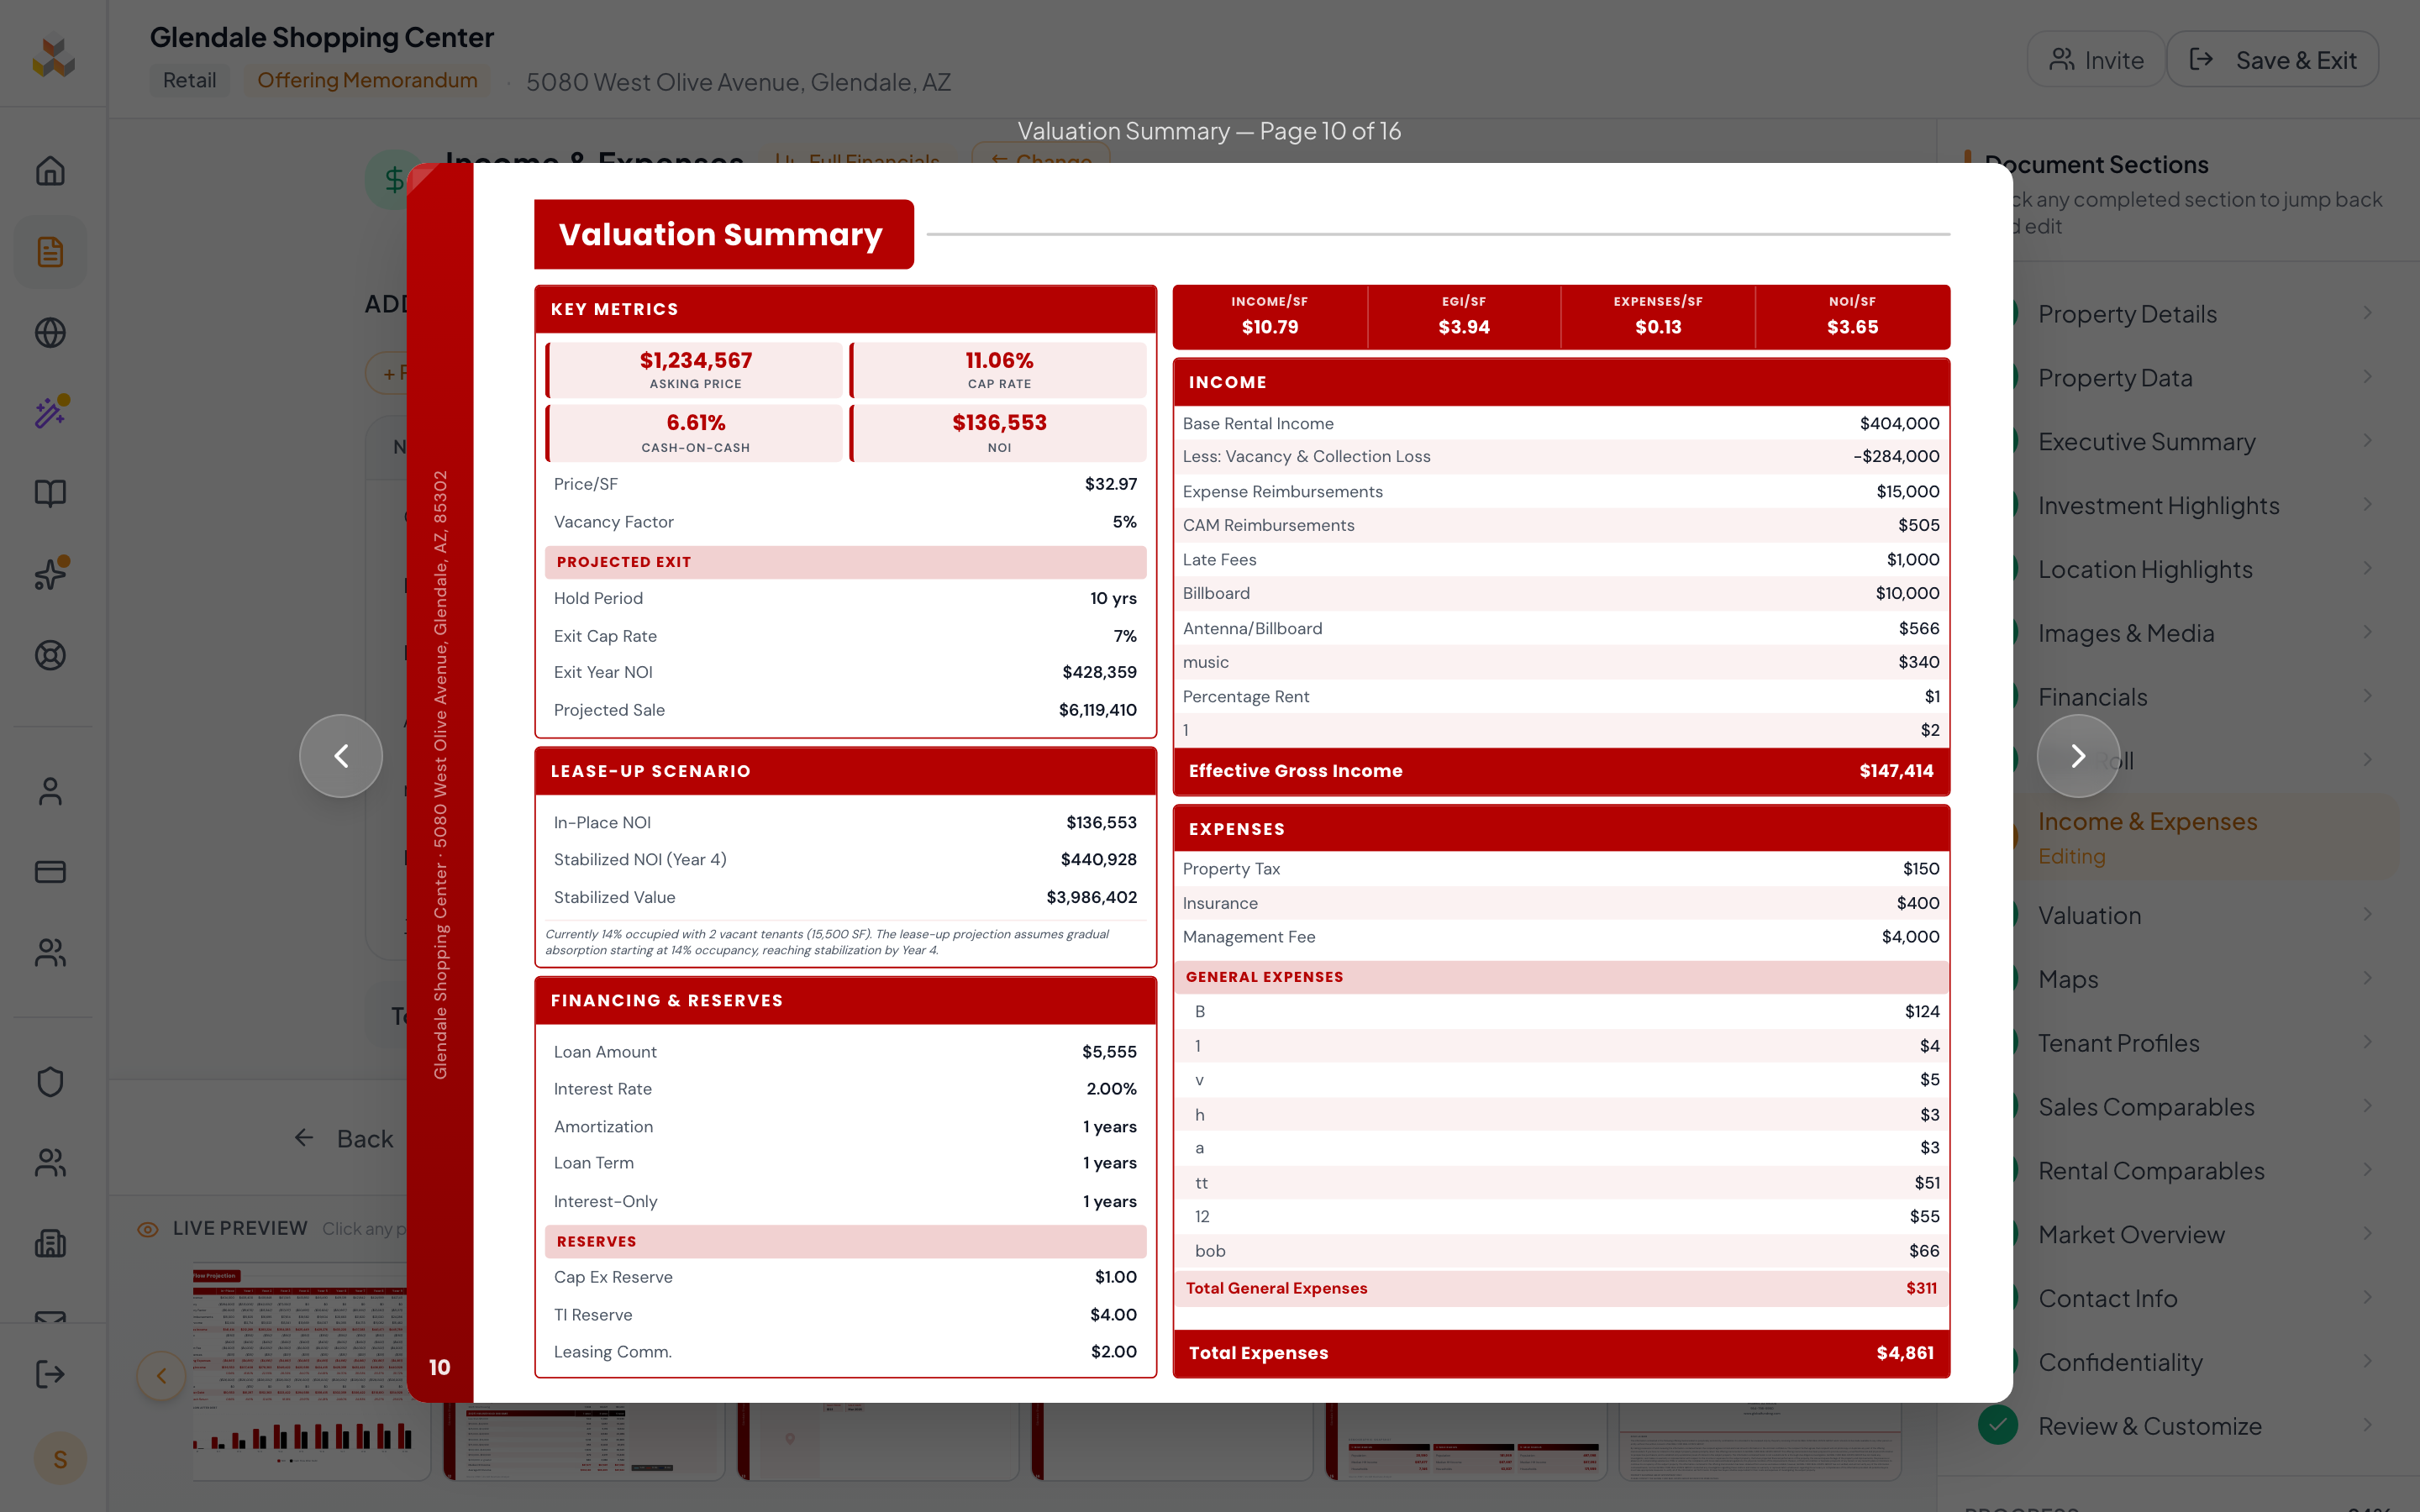
15. Valuation & Cash Flow
Set valuation assumptions and review the auto-generated cash flow projection. Cap Rate, Cash-on-Cash Return, and multi-year NOI projections all derive from your rent roll, income/expenses, and the assumptions you set here.
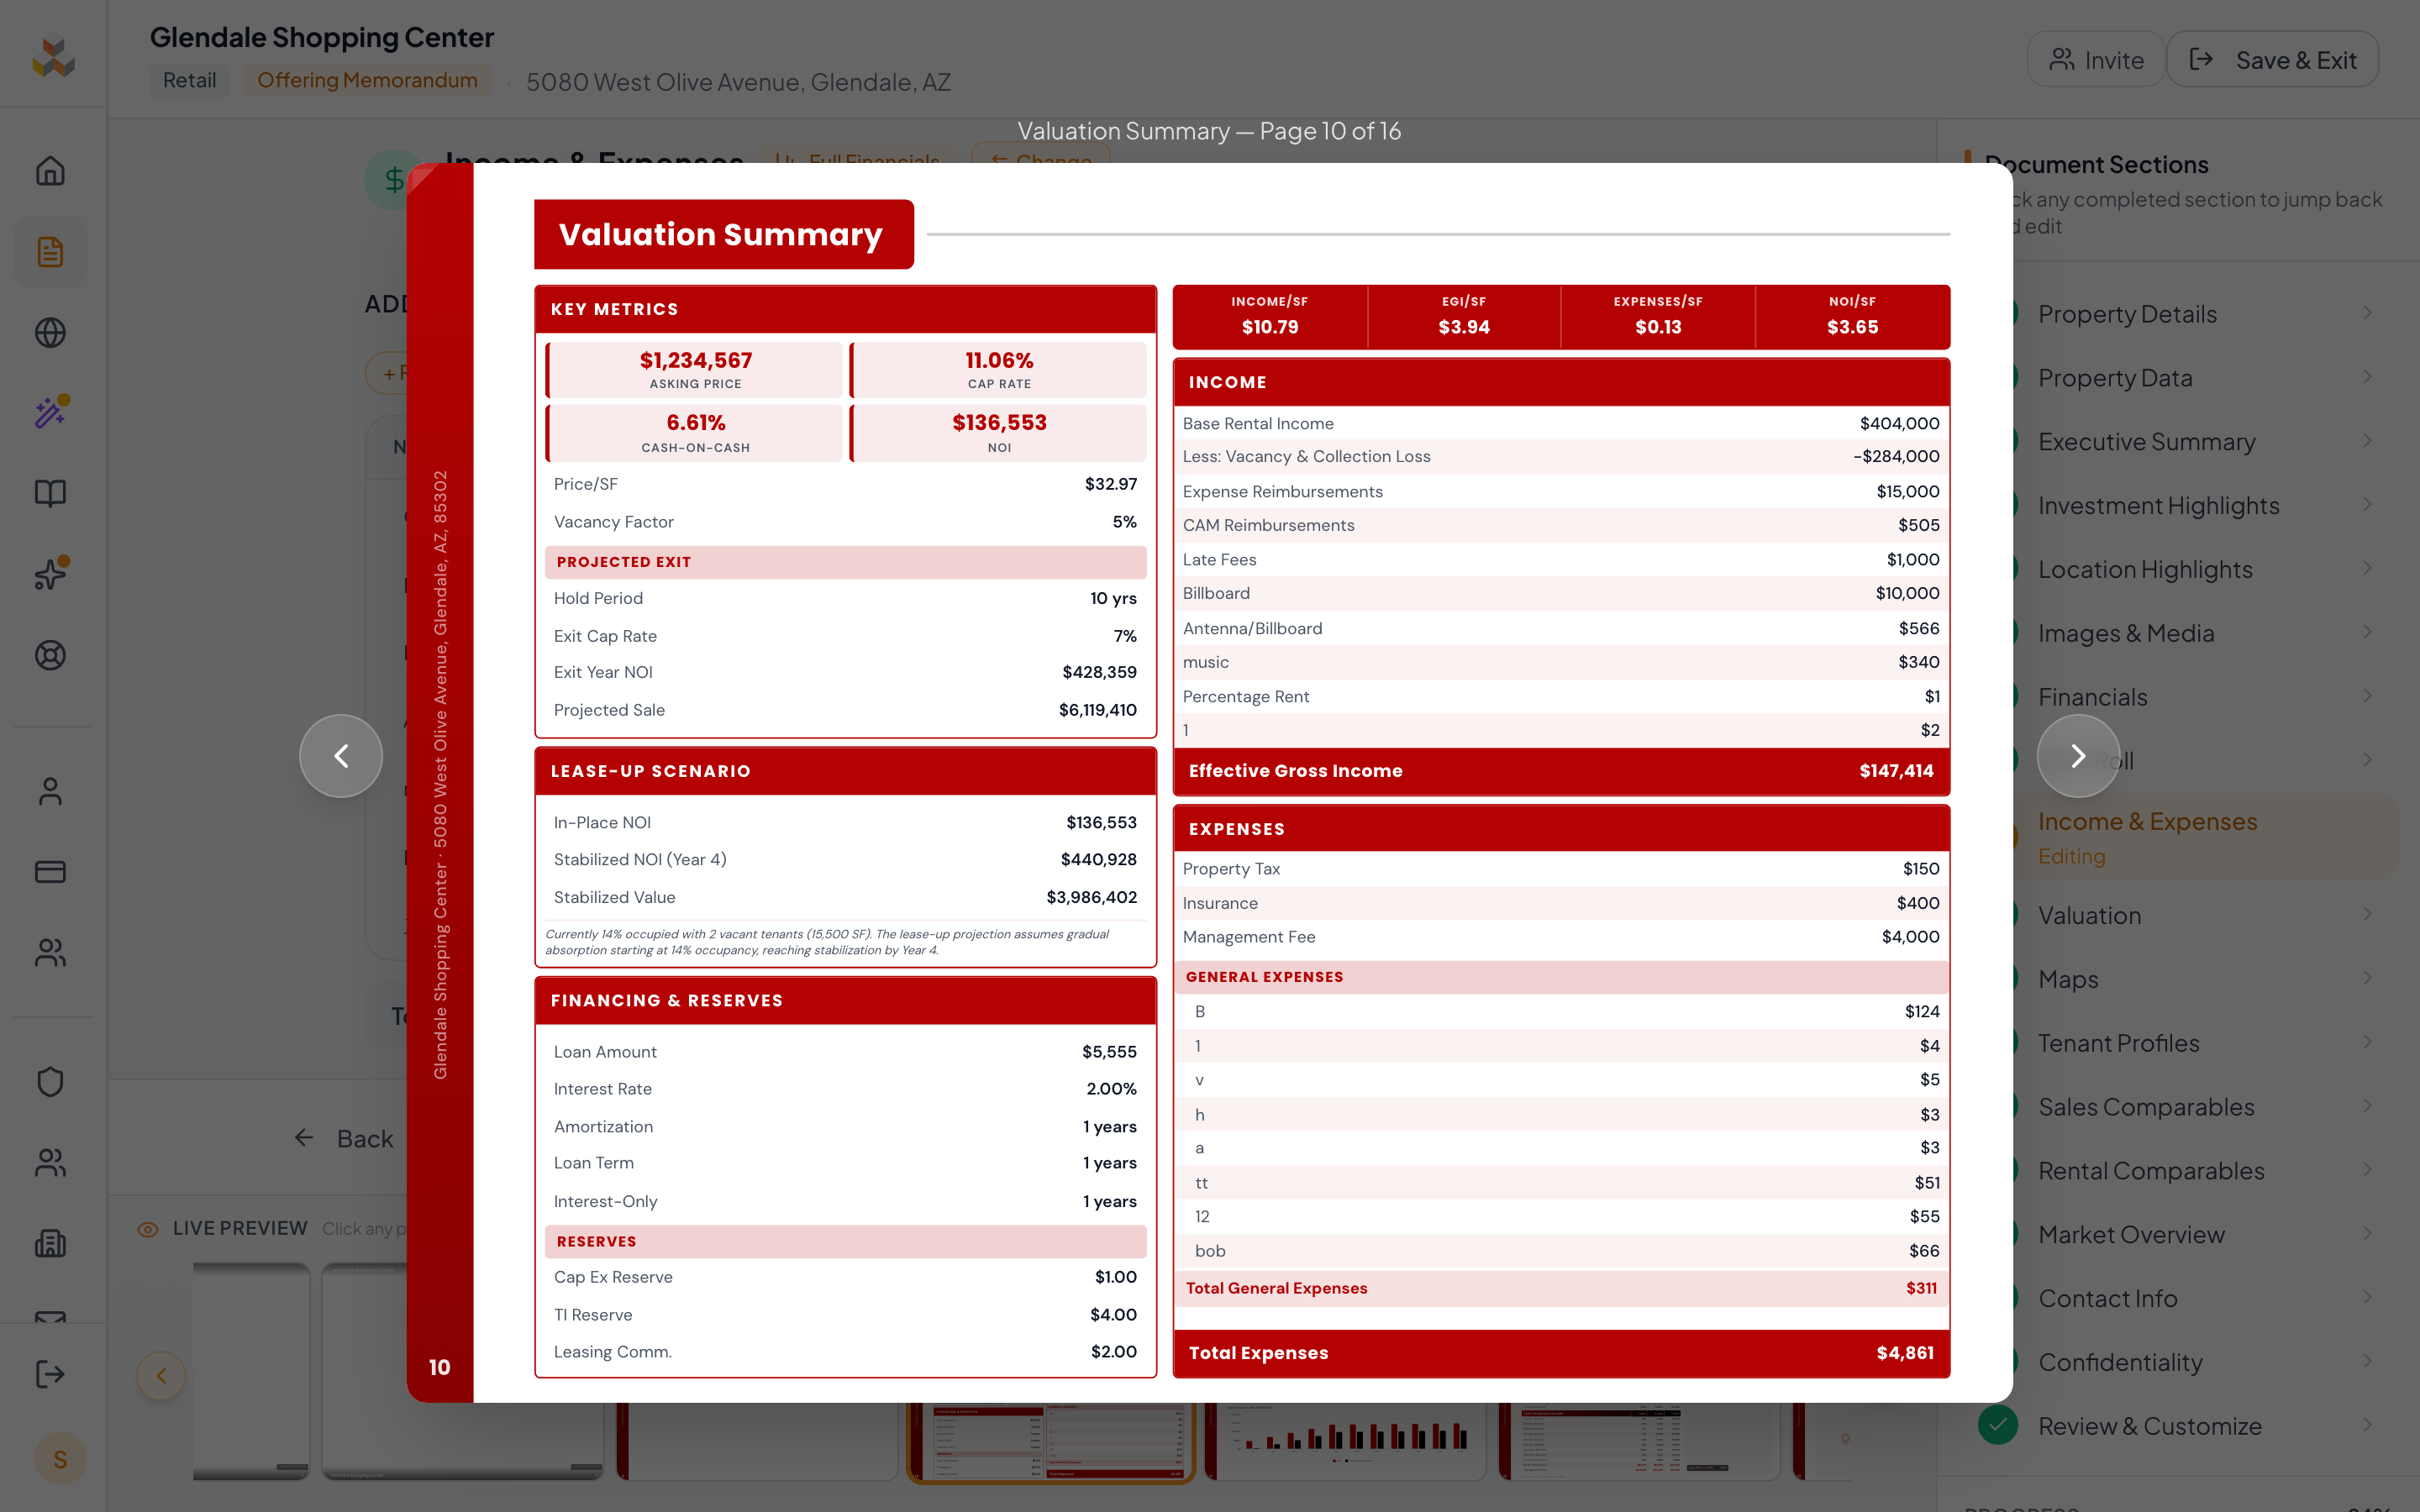
- 1Assumptions — Analysis Period (1-10 years), Exit Cap Rate, Turnover Rate. Drives the multi-year cash flow table.
- 2Growth — Income and expense growth rates (per category and per line item). Used for the cash flow projection if you picked Multi-Year Cash Flow rent roll.
- 3Financing — Optional Loan Amount, Interest Rate, Amortization, Loan Term. When filled in, Cash-on-Cash Return and Debt Service appear on the projection.
- 4Reserves — Capital Expenditure Reserve, Leasing Commissions, Tenant Improvement Reserve. Reduces projected NOI.
For Multi-Year Cash Flow rent rolls, the projection shows year-by-year growth. For Pro Forma rent rolls, it shows the in-place-to-stabilized step-up. Both modes auto-calculate the Cap Rate, NOI, and Price/SF metrics that appear elsewhere in the document.
16. Tenant Profiles
Add detailed profiles for your key tenants. Especially valuable for single-tenant net-lease properties or when tenant mix is a key selling point. Each populated profile gets a dedicated page in the document.
- 1Empty state — For empty rent rolls (or property types where tenant detail isn't typical), this step shows an "Add First Tenant" button. Click to add a tenant profile manually.
- 2Tenant cards — Each tenant from your rent roll appears as an expandable card. Click to add company description, industry, year founded, headquarters, locations, credit rating, lease expiration, and logo.
- 3WALT (Weighted Average Lease Term) — CREBuilder calculates WALT — the SF-weighted average years remaining across your leases — automatically from the Rent Roll lease end dates. (SF-weighting is the standard convention for multi-tenant retail and office.) WALT is the single most-asked metric for multi-tenant or NNN deals; longer WALT = more income certainty. Make sure every tenant has a Lease End Date for an accurate WALT.
Focus on credit tenants and anchor tenants — buyers want to see company details, credit ratings, lease terms, renewal options, and rent escalations for the largest tenants driving the property income. WALT and rent escalations matter even more than headcount.
17. Sales Comparables
Recent property sales in the area that support your asking price. Comparable sales help investors understand the market and validate the property valuation.

- 1Empty state — New docs land on an empty-state card with an "Add First Comparable" button. Click to open the entry form.
- 2Per-comp fields — Property name, address, sale price, sale date, cap rate, building size, price per square foot. All fields are optional — enter what you have.
- 3Selection conventions — Industry convention: comps within the past 12 months, within a 5-10 mile radius, same asset class, and similar size band (±50% SF). Most OMs include 3-5 comparables for a representative market sample.
Choose comps that support your pricing. Include a mix slightly above and below your asking price to show fairness, with the average near your target cap rate. Buyers' analysts will reject comps that are stale (>12 months), off-asset-class, or wildly different in size.
18. Rental Comparables
Comparable lease rates from nearby properties — demonstrates that your rents are at, below, or above market. Particularly important for multifamily and retail with rolling lease expirations.
- 1Empty state — "Add First Comparable" button when empty. Each comp captures property name, address, rental rate, building size, and property type.
If your property has below-market rents, rental comps are your strongest tool to show value-add potential. Highlight the gap between in-place and market rates.
19. Market Overview
CREBuilder auto-generates market overview content using public data sources. The city description, population data, and economic facts pull automatically from Wikidata and census databases based on your property location.
- 1About text — Auto-generated city/market description from Wikipedia/Wikidata. Edit freely — add local market knowledge, recent development activity, or specific submarket data.
- 2Market image — Choose a city skyline or area photo from the built-in image library, or upload your own.
- 3Key Facts — Data points like Population, Median Household Income, Employment Rate, Major Employers. Some facts auto-populate from census data; drag rows to reorder.
Auto-populate is owner-only — collaborators and admins viewing the doc won't accidentally overwrite saved content. If a teammate opens the doc and your auto-fetched text looks different, your saved version is the one preserved.
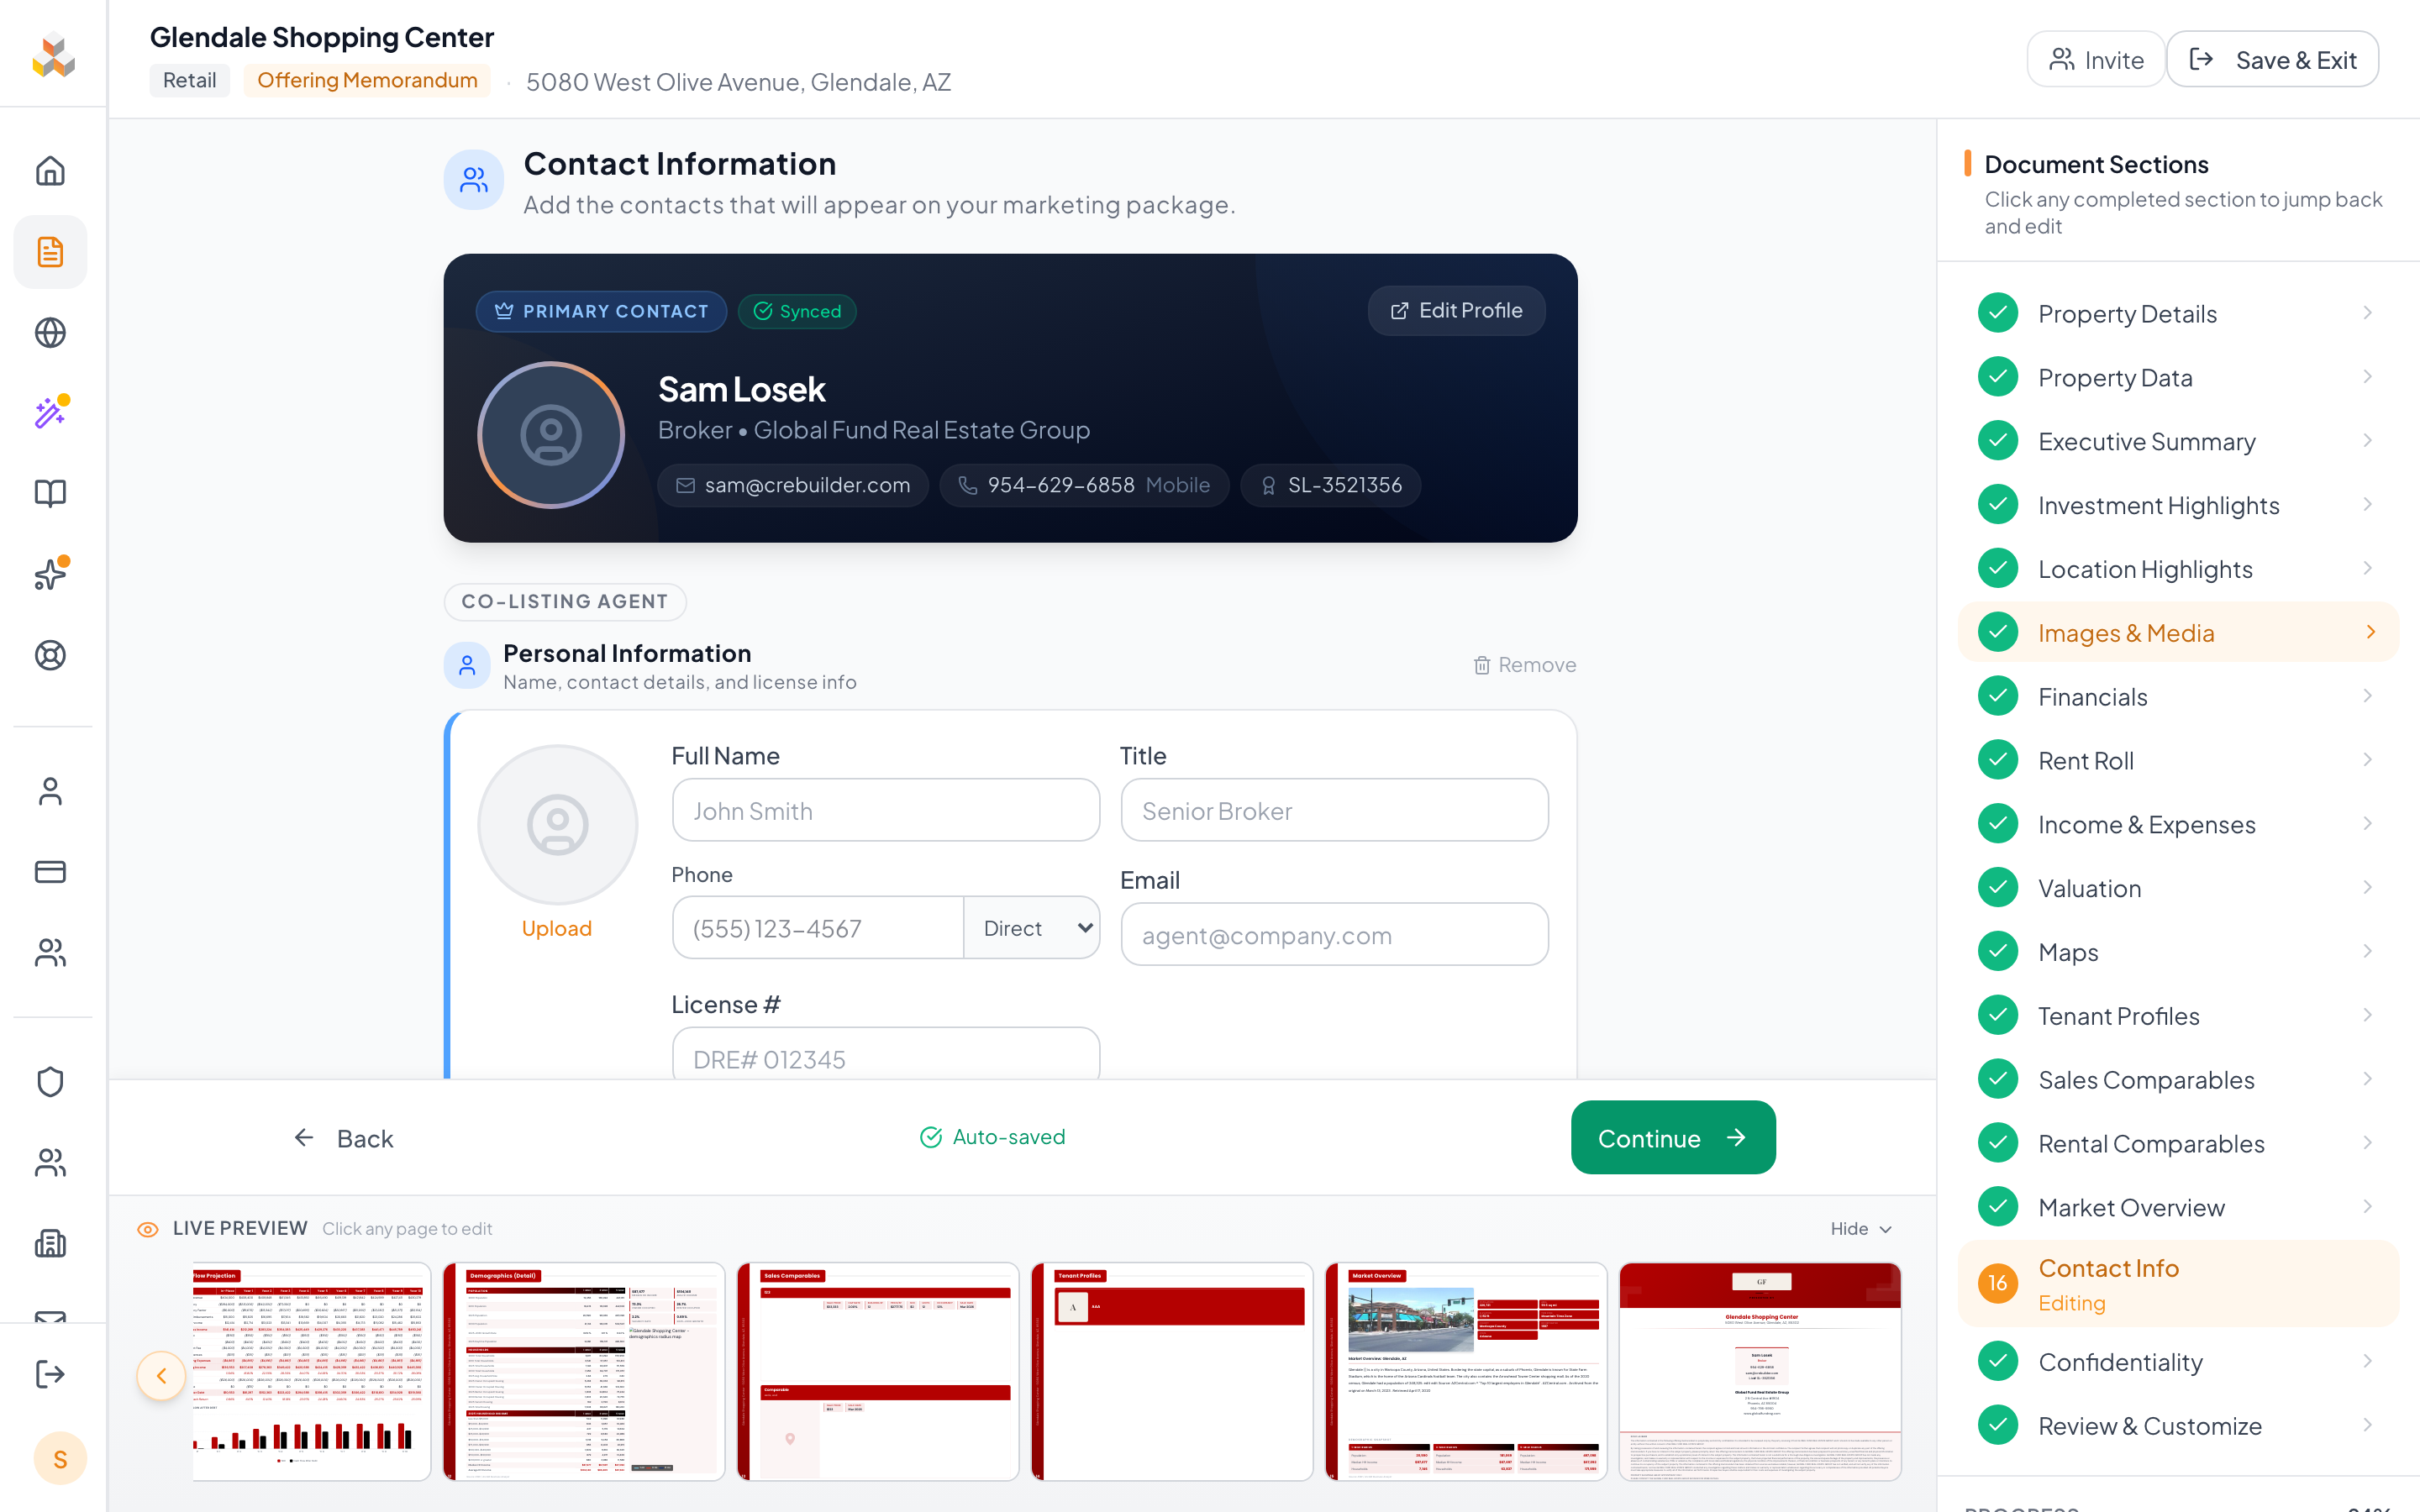
20. Contact Information
Your contact information for the closing page(s) of the document. The primary contact is pre-filled from your profile. Add co-listing agents from your team or enter their details manually for external co-brokers.
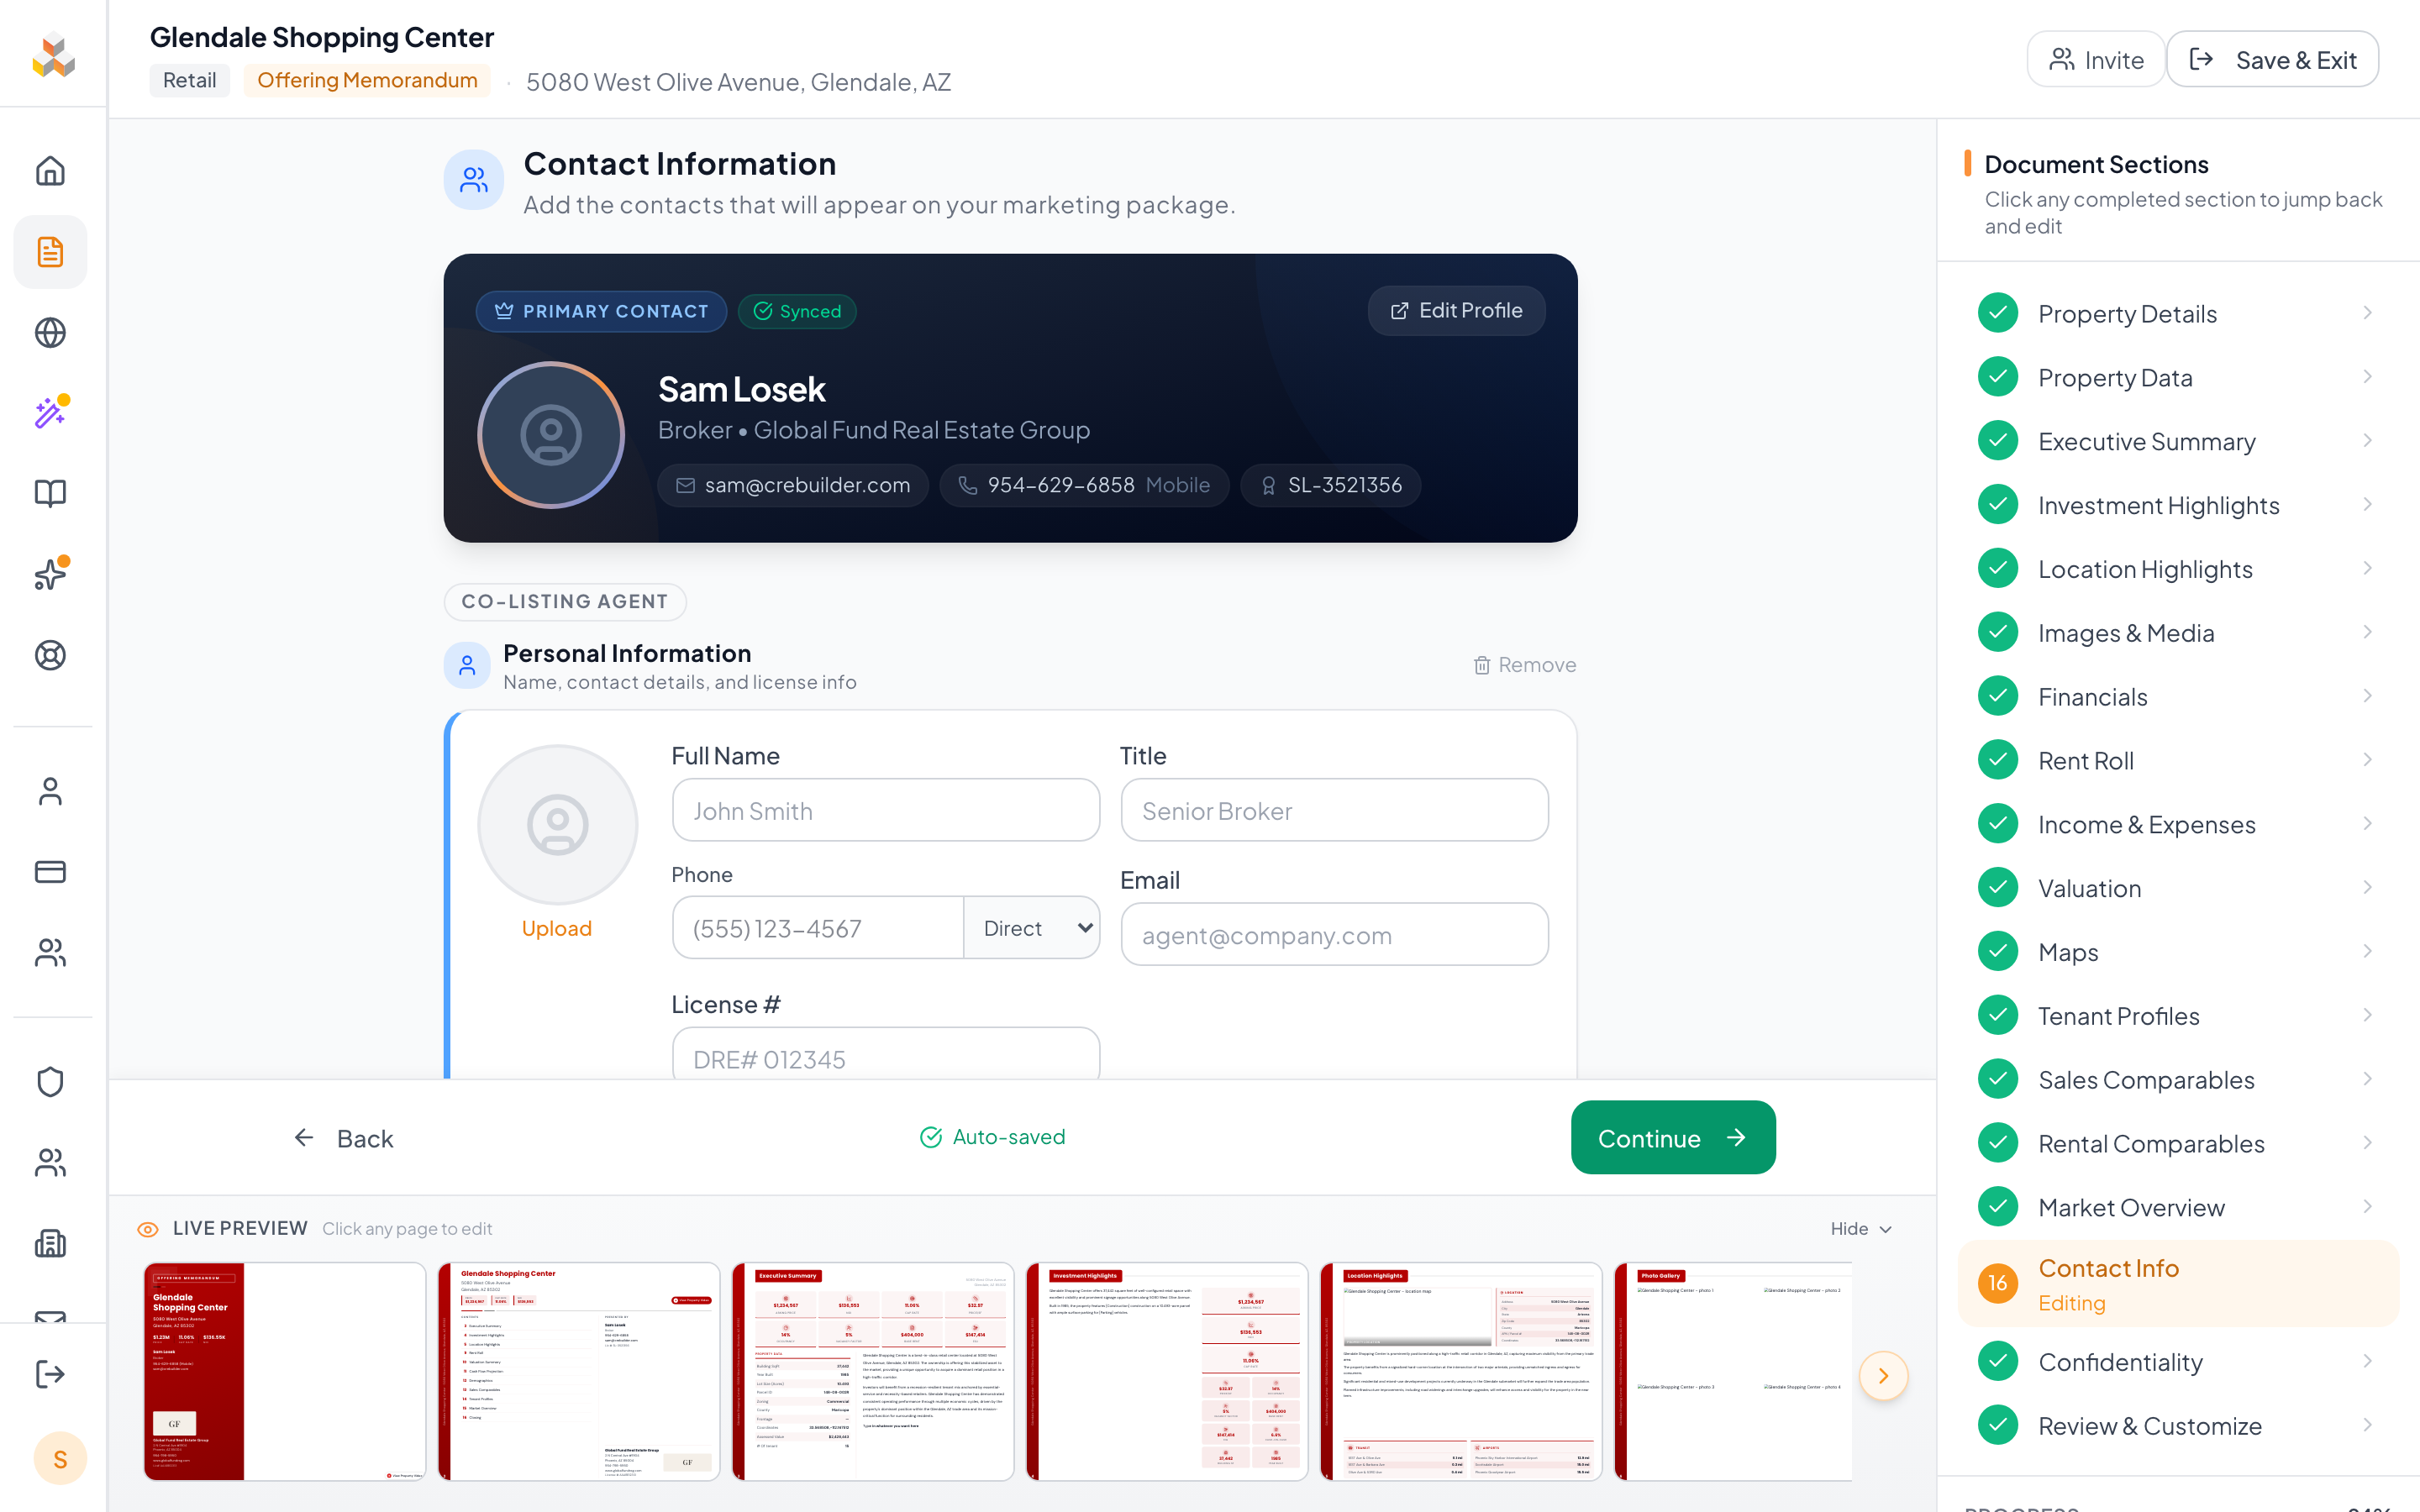
- 1Primary contact — Auto-filled from your user profile. Changes here apply to this document only — your global profile is untouched.
- 2Co-listing agents — Add team members or external contacts. When adding a team member, their full profile (title, phone, license, headshot, company logo) carries through automatically.
Your profile photo and company logo appear on the contact page. Make sure they look professional — update them under Settings → Profile.
21. Confidentiality
Confidentiality disclaimer and legal notice. CREBuilder ships with professionally-written defaults; you can also paste your brokerage's approved boilerplate.
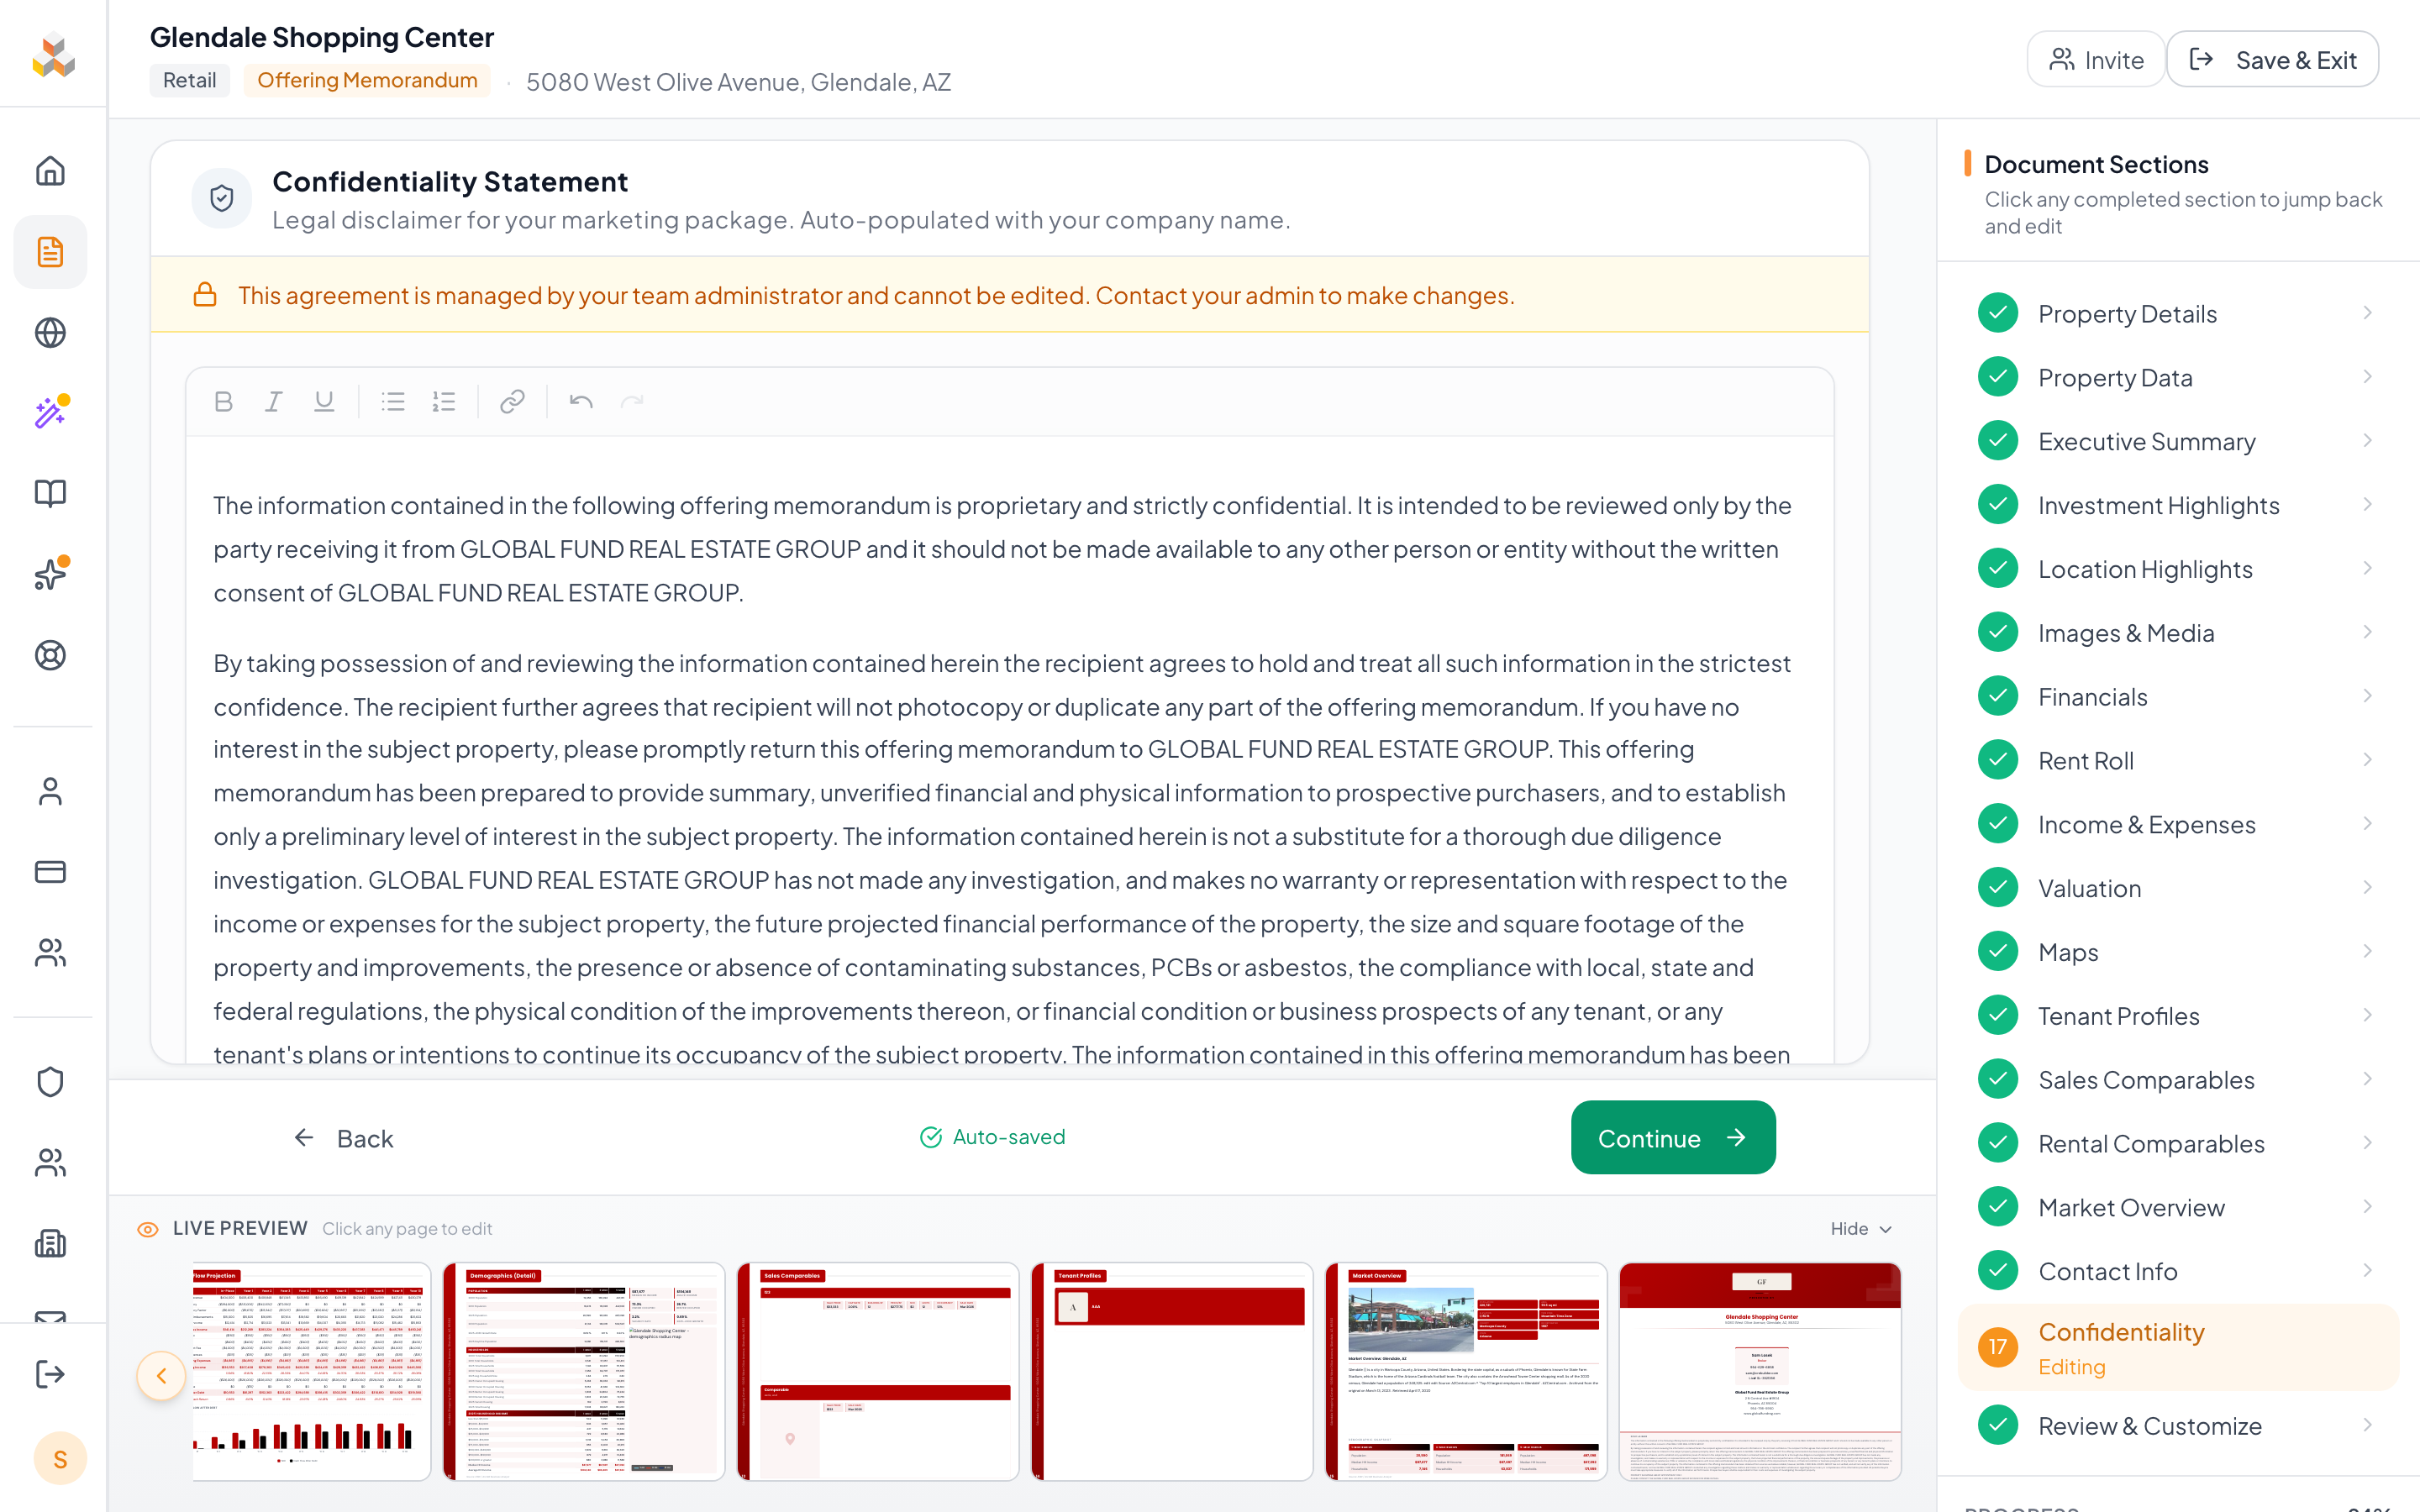
- 1Disclaimer editor — Rich text editor pre-filled with standard CRE confidentiality language. Edit freely.
- 2Templates — Pre-written variants covering standard confidentiality, investment risk language, and broker authorization clauses.
Most brokerages have a standard disclaimer they use on every marketing piece. Ask compliance for the approved language and paste it once — future documents start from your custom default.
22. Review & Customize
The final step: preview your complete document, customize design, reorder/hide pages, and export to PDF. Every page renders in real-time exactly as it will appear in the downloaded file.
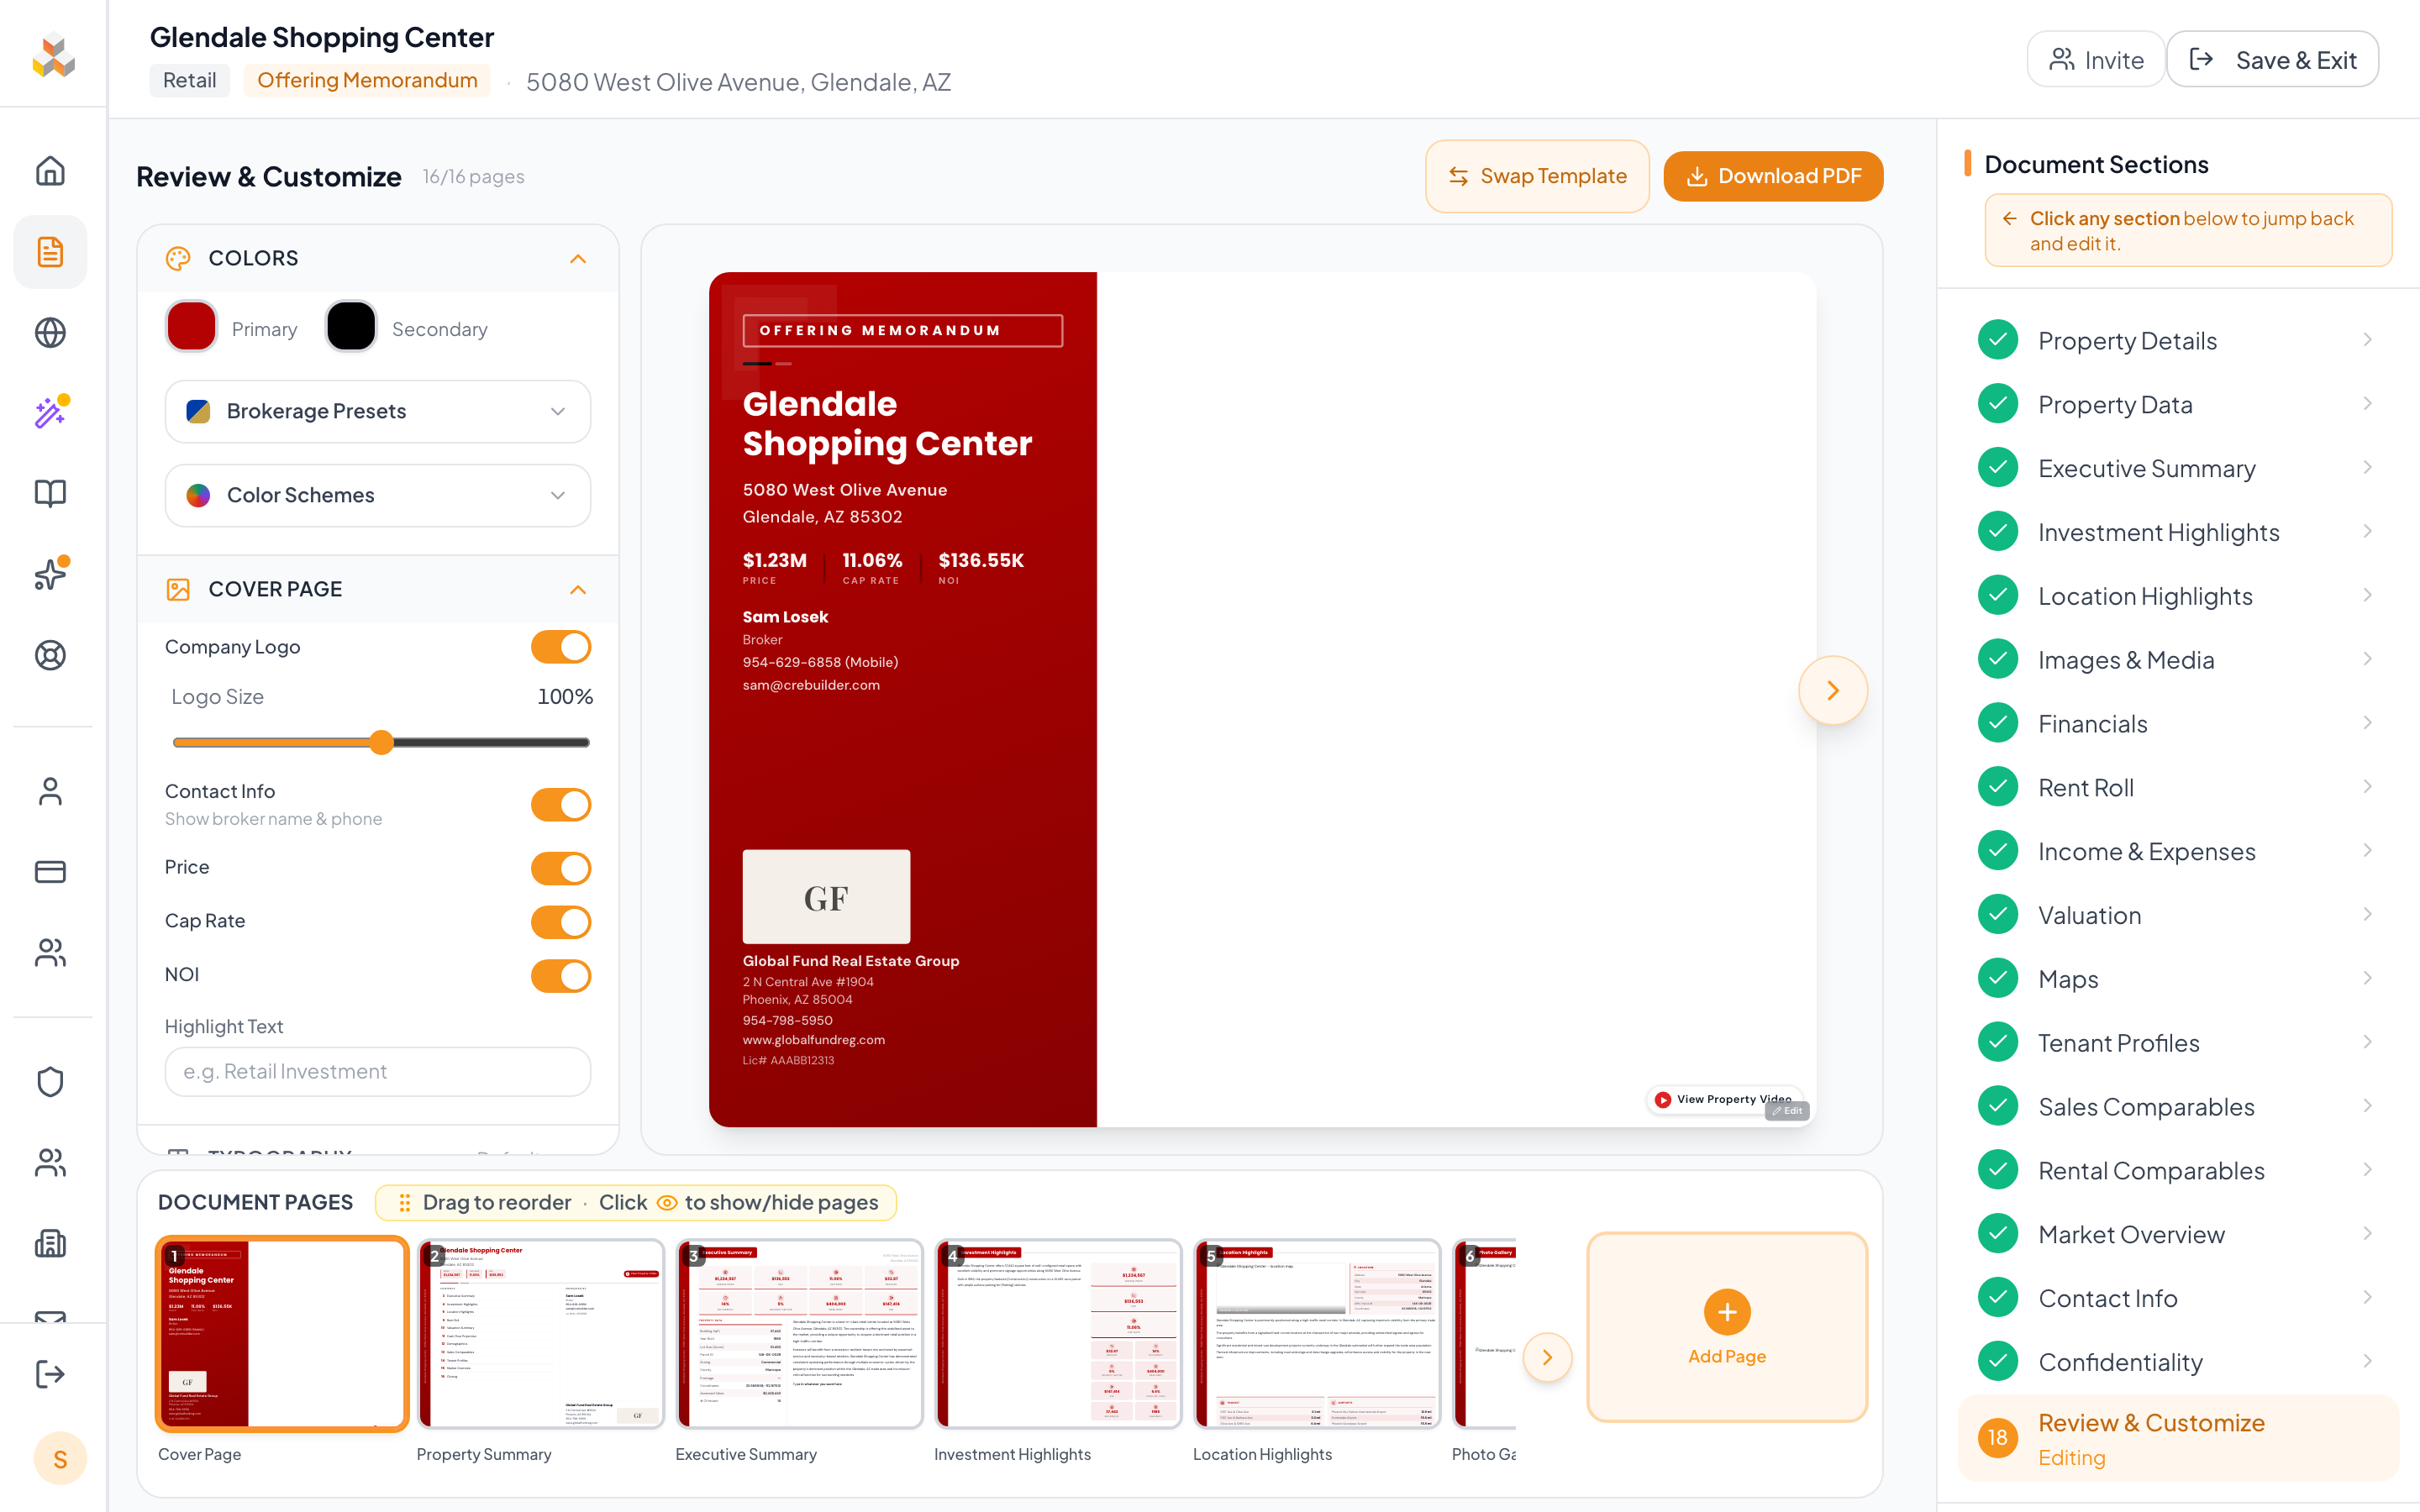
- 1Design panel (left) — Fine-tune colors, logo size, contact info display, price/cap-rate visibility on the cover, and highlight text. Changes preview live in the center.
- 2Live preview (center) — Full-size preview of each page. Click arrow keys or page thumbnails to navigate.
- 3Page thumbnails (bottom) — Drag-and-drop to reorder. Click a page to see it in the main preview. Toggle visibility to hide pages from the final PDF.
- 4Swap Template — Switch theme themes anytime — all your content transfers instantly so you can try different designs.
- 5Download PDF — Generate and download as a high-quality PDF (Pro subscribers). Free Starter users see an "Upgrade to Download" button instead.
Pro subscribers can also publish the doc to a public Property Hub — a shareable web URL with embedded video, photos, and a contact form. Look for the Share button next to Download PDF.
Need Help?
Our team is here to help you create professional marketing documents.